Activity Diagram 
The Activity diagram (and the EFFBD, its cousin in traditional representations) are the most complete representations of behavior. Part of the behavioral (logical architecture) representation set, they unambiguously represent the flow of control through sequencing of activities and constructs as well as the data interactions overlaid to present a more complete picture.
The activity diagram is available for entities in the Function class (as well as any other subclasses of ProcessingUnit).
The similarities between activity diagrams and EFFBDs are not coincidental. Not only are they working to address the same fundamental need (a more comprehensive representation of behavior), but the EFFBD notation was used for both guidance and verification by the SysML team during the development of the activity diagram. The net result is closely coupled representations that you can select from to best meet your analytical and communication needs. Activity diagrams classically appeal to the software community given their representational similarity to UML. EFFBDs are often more understandable by customers, domain specialists, and end users.
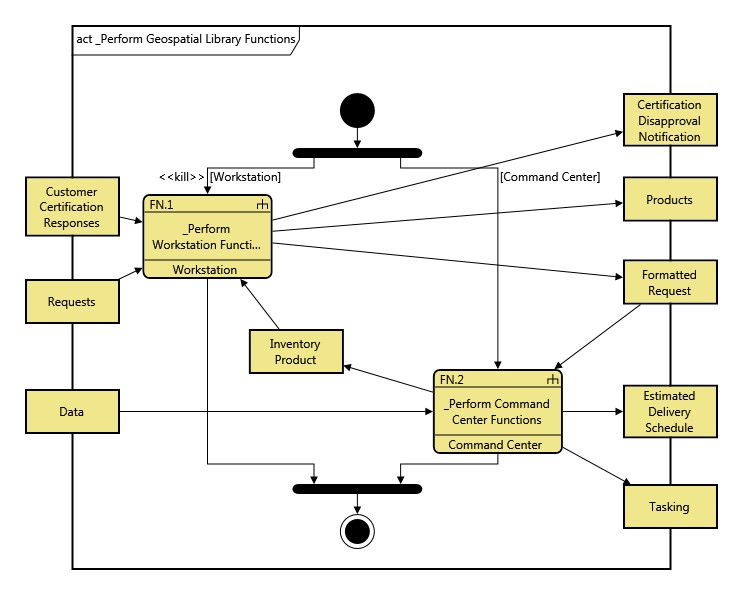
When drawn horizontally, the flow of control is left to right. When drawn vertically, the flow of control is top to bottom. Activity diagrams by default are set to vertical orientation, but that can be modified in the Project Permissions. Rounded rectangles represent functions. Diamonds and bars represent control constructs - the building blocks of behavior. As an activity completes, flow of control proceeds along the branch lines to the next activity or control construct. Each construct has a precise definition that prescribes how control will be passed within the construct and when the construct itself will end. This combination is fully executable (not just animated) by the simulator.
GENESYS supports the standard hierarchical features of logical architectures. When the decomposition of an entity has been specified, the icon representing that entity has a decomposition symbol in the upper right corner as a visual cue.
The rectangles on an activity diagram represent the items or the data interaction aspect of behavior. Whereas most behavioral representations focus on either the control or the data, the activity diagram and EFFBD represent both to provide full context and understanding. The activity diagram distinguishes between the two primary roles that items play:
- Triggers - control the execution of a function by their presence or absence. Triggers can be simple signals or actual objects. The designation does not come from the item itself but from the relationship between the item and the function (an item can be an input for one function and a trigger for another function). Items that trigger a function are drawn with a standard arrow to that function with no additional decoration.
-
Data Stores - input to or output from a function with no control implications. Items that are input to a function are drawn with a standard arrow to that function with a label decoration indicating <<optional>> at the point of connection with the function. They can also be toggled off in order to better focus on triggering data and its sequencing effect
|
NOTE: |
Trigger and Input? It is not necessary to connect an item to a function as both a trigger and an input. It is implicitly understood that a trigger is also an input to the function. |
Understanding whether an item is local in scope or used beyond the bounds of a given activity can provide valuable insight when engineering and assessing a system. To help visualize this, boundary items those items which are input to, output from, or trigger a function beyond the scope of the current activity and its decomposition can be optionally constrained to the diagram frame. When this option is selected in the diagram properties, the difference between local items (drawn in the interior of the diagram) and items used elsewhere in the system model (drawn on the diagram frame) is immediately evident. By default, this option is enabled for new activity diagrams, delivering the maximum insight from the item positioning. A function begins execution when it has received all of its triggers and its necessary resources have been acquired. If the flow of control has reached a function but either the triggers or resources are not available, the function is said to be enabled but waiting. Obviously, this has notable impacts in the sequencing and synchronization of behavior as well as the overall performance (how quickly the process completes) and whether or not it can complete at all due to live-locks and deadlocks.
|
NOTE: |
A good reference for further information on activity diagrams is chapter 9 of A Practical Guide to SysML: The Systems Modeling Language by Sanford Friedenthal, Alan Moore, and Rick Steiner (2012). |
Toolbox Properties
In addition to the classic diagram options, the activity diagram settings include:
- Show Data Nodes - controls whether data stores will be shown by default. In cases where there is a large amount of data flow, it can be helpful to hide data stores to focus attention on triggering data.
- Constrain Boundary Items to Frame - controls where items are shown on the frame of the diagram or are left free-floating. The advantage of showing the boundary items on the frame is to know when an Item crosses the system boundary.
- Show Control Flow with Dashed Lines - controls whether control flow in the diagram displays with dashed lines.
Toolbox Insert
The Constructs, Utilities, and Key Entities tabs allow you to quickly develop your activity diagram, while the All Entities tab enables you to relate your diagram entities to the remainder of your system definition.
Constructs
- New Entity - drop onto a branch to insert a new activity (function) as part of the diagram decomposition (decomposed by)
- Entity - drop onto the diagram background to insert an existing activity (function) as part of the diagram decomposition (decomposed by)
- Parallel - drop onto a branch to insert a new parallel construct (concurrency) with two branches
- Select - drop onto a branch to insert a new select construct (exclusive OR) with two branches
- Loop - drop onto a branch to insert a new loop construct
- Loop Exit - drop onto the end of a branch within a loop construct to insert an exit from the enclosing loop
- Iterate - drop onto a branch to insert a new iterate construct
- Replicate - drop onto a branch to insert a new replicate construct
- Exit - drop onto the end of a branch to insert a new exit from this decomposition
- Exit Condition - drop onto a function node to add an exit branch
- Branch - drop onto a parallel or select construct to add an additional branch
- New Input - drop onto any function node to create a new item that is input to the node
- Inputs - drop onto any function node to relate an existing item that is input to the node
- New Trigger - drop onto any function node to create a new item that triggers the node
- Triggers - drop onto any function node to relate an existing item that triggers the node
- New Output - drop onto any function node to create a new item that is output from the node
- Outputs - drop onto any function node to relate an existing item that is output from the node
Utilities
- Image - drop onto the diagram to insert a new picture
- Note - drop onto the diagram to insert a new note (descriptive text in a note icon)
- Shapes - drag one of the shapes from the toolbox and drop onto the diagram to insert a new shape
Key Entities
- Component - drop an existing component onto a function to relate it to the node using the performs relation
- DomainSet - view the existing DomainSet entities in the project
- Exit - drop an existing exit onto a function node to assign the exit as an exit condition (exits by)
- Function - drop an existing function onto the diagram background to it as part of the diagram decomposition (decomposed by)
- Item - drop an existing item onto a function node to relate it to the node using the input to, triggers, or output from relation
All Entities
All classes and entities in the system model, allowing you to drag any entity on top of a diagram node to establish relationships with the balance of your system model
Context Menu Commands
- Insert
- Entity
- Parallel (AND)
- Select (OR)
- Branch
- Loop
- Loop Exit
- Iterate
- Replicate
- Exit
- Rename
- Renumber
- Set Attribute
- Remove
- Delete
- Hide
- Cut
- Copy
- Paste
- Arrange
- Bring To Front
- Bring Forward
- Send Backward
- Send To Back
- Open Entity
- Submenu listing all entities
- Select Matching Nodes
- Layout Selections
Depending on what is selected on the diagram, the following options may be available:
- Edit Annotation
- Edit Selection Probability
- Toggle Kill Status
- Edit Branch Position
- Edit Domain Set
- Edit Exit Conditions
- Data
- Edit Inputs
- Edit Triggers
- Edit Outputs
- Connect Via Input
- Connect Via Trigger
Tips and Tricks
- Double-clicking on constructs is a shortcut for editing their specific properties. Double-clicking on a branch allows you to edit the branch annotation. Double-clicking on an iterate or a replicate allows you to specify the corresponding domain set. CTRL+double-clicking is a shortcut for adding a branch to a parallel or select construct.
- When using commands to manipulate the diagram (or when double-clicking a construct on the toolbox for quick insertion), first select the branch to insert and the end of the branch. To insert before a construct, have the construct selected.
- When using drag-drop to manipulate the diagram, dropping a node or construct on the background adds the object to the end of the main branch. Dropping it on a branch inserts at the specific position on the branch.
- Using CTRL while using drag-drop will either move the selected node(s) or insert a copy of the selected node(s). Hold CTRL before dragging to use this feature. If you release CTRL before you release the mouse button, the node(s) will be moved to the new position. If you continue to hold CTRL until after you release the mouse, the node(s) will be copied into the new location.
- Once you have established an item on a diagram as an input, output or trigger, you can drag-drop that item node onto a function node within the diagram to quickly establish your data relationships.
- When rearranging nodes on your diagram, arrange the function nodes first. Items are positioned relative to their corresponding functions, by default, so items may shift as functions are repositioned.
- Nested logic is used when determining the color for constructs. Therefore, setting the color scheme for a parallel construct affects all constructs within that construct that are set to use the default color scheme. This allows you to quickly apply color schemes to nested constructs.
- The activity diagram does not traditionally lend itself to the use of graphical images in place of geometric nodes. For this reason, you can achieve great impact if you selectively use images that reflect movement and motion to highlight a critical aspect.
- By default, the function icon displays the component the function is allocated to as the bottom line. Maintaining this representation complements the logical architecture with the physical allocation.
- While most users think of dragging objects from the toolbox onto the diagram, you can also drag objects from the diagram onto toolbox entities to establish relationships. This is particularly useful when allocating functions. Shift+click to select the functions of interest and then drop them onto the performing component on the All Entities tab to allocate several functions at once.