Presentation Layer - Delivering Substance with Style
Technically correct diagrams are essential for good systems engineering, but correctness alone is not enough. Systems engineers live in a diverse world - spanning technical disciplines and market domains. Addressing systems challenges requires that you communicate with customers, users, and specialists. To support this need, GENESYS provides a rich presentation layer allowing you to generate your system diagrams with a blend of traditional geometric blocks, stock pictures, and custom images. Style options enable you to hide peripheral information and focus attention on content you deem critical. Leveraging the presentation layer enables you to deliver enhanced analytical value and customer communications directly from within your MBSE framework.
As you work with the presentation of a diagram, GENESYS automatically tracks these changes and saves them in a stored view description. When the diagram is next opened - whether on the screen within GENESYS, through an internet browser for GENESYS web, in the Team View HTML output, or in a formal report - GENESYS applies your specific presentation with the current state of the model to deliver guaranteed engineering correctness with polish, flair, and style.
Moving and Resizing Diagram Objects
GENESYS's diagram framework automatically generates each diagram from the underlying system model when you open the view. The framework has specific layout rules to auto-position diagram content. Some diagrams are relatively free-form (the spider diagram, for example). Others - sequence diagrams and EFFBDs to name just two - have highly specific formats. GENESYS's fundamental framework takes care of these layout issues so that you can focus first on engineering content rather than specific positioning.
That said, as the engineering content begins to take shape, adjusting the diagram layout can greatly enhance the analytical and communication value. As with standard technical drawing packages such as Microsoft Visio®, you can click on a selected node (or nodes) to reposition the selected nodes as desired. Free-form diagrams (e.g., spider diagrams) allow nodes to be moved anywhere. Some diagrams (e.g., sequence diagrams) have strict layout constraints with nodes constrained to move vertically along life lines. Other diagrams (e.g., activity diagrams and EFFBDs) represent a mix with constructs constrained to move horizontally or vertically along branches and overlay nodes (item and resource nodes) free to move anywhere on the diagram.
To resize a node, select the node and then manually adjust the desired sizing handle. Nodes indicate in which directions they can be resized. Dragging a handle in the middle of a face constrains the node to resize in one direction only. Dragging a handle at a corner allows the node to resize in multiple dimensions simultaneously. Or you can use the auto-size or auto-size height command to resize specific nodes, labels, or all diagram content.
Representing Entities
Classical engineering diagrams include basic boxes, lines, and labels. While suitable for many analytical tasks, full analysis and broad communications with diverse stakeholders requires a much richer representation set. Node templates - completely customizable by the project team - allow you to determine how an entity is represented on a diagram. This can be as basic (the abbreviation or name) or as rich (number, name, allocation, etc.) as you desire.
To call attention to objects of interest, you have complete control over the text, line, and fill colors for each entity - both at a database level and at the individual entity level. You can set colors at the entity level so that a specific entity is colored automatically across all diagrams or color specific diagram nodes to customize the style of a given diagram.
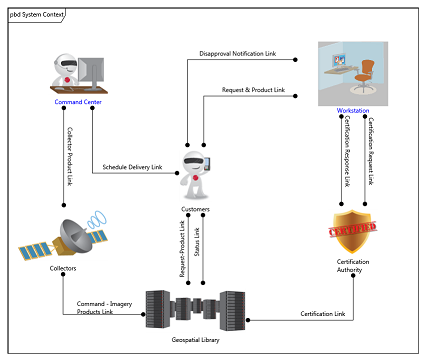
GENESYS allows you to represent a given node as an image with label or as a traditional geometric frame. As with icon templates, this can be specified for an entire diagram or a single node. For an individual node or the entire diagram, you can select the representation that best suits your needs. GENESYS provides both stock graphic libraries to draw from as well as allowing you to use your own graphic files to customize the representation. In this case, a picture is truly worth a thousand words.

Notes, Shapes, and Images
Sometimes, we need more than raw engineering content to capture and communicate the essential information. GENESYS allows you to insert:
-
- Notes to add explanatory text or context to a diagram.
- Shapes (rectangles, rounded rectangles, circles and more) to add a splash of style, emphasizing key aspects, or implying grouping and clustering.
- Images to include team or project logos, complementary items, and graphical backgrounds. Graphics can be drawn from GENESYS's stock library or your custom graphic files.
When drawing diagrams, the order (from front to back) is controlled by selecting the object and using the context menu, under the Arrange submenu, to:
|
CAUTION! |
Notes, shapes, and images are all stored as part of the diagram's stored views. If you reset the diagram by opening the diagram while holding down the CTRL and SHIFT keys together, you will delete any notes, shapes, and images on the diagram along with all other customizations of the diagram representation (sizing, coloring, positioning, etc.). |
Hiding Diagram Content (Eliding in SysML Terminology)
Sometimes comprehensive and complete diagrams can complicate communication. GENESYS leverages the SysML concept of eliding content, more commonly known as selectively hiding / showing content. You can select specific nodes on a diagram and then toggle them to show or hide. You can also control the current presentation mode of the diagram, showing all content, marking content, or hiding as desired. This capability allows GENESYS to deliver comprehensive, complete, correct representations from the underlying model without sacrificing communication. You can focus audiences on the areas of interest without having to manage and synchronize separate artifacts.
Diagram Properties Options
Sometimes, you want to customize at a diagram level (either in conjunction with manipulating individual node presentation or simply to control some high level options). Each diagram contains a specific set of options governing optional content to display or hide, diagram level coloring, icon sizing, and presentation, etc. The initial layout settings for diagrams are all managed via the project preferences to maximize consistency of diagrams across the project team. Options for an individual diagram are controlled via the properties tab in the toolbox. Interaction defaults (show animations, whether grid lines are displayed, etc.) are controlled by your user preferences and are available on the Diagram Ribbon. If you want to reset the diagram properties to the defaults so that they match the project properties, you can either reset the stored view by selecting the parent entity and opening the diagram while holding down the CTRL and SHIFT keys. Resetting colors to the project preferences is easy - simply select the Automatic option at the top of the color picker. The other options would have to be set to the project preference values.
Object Properties
Sometimes customizing at the diagram level is not enough and you need to set properties on individually or a small set of objects on the diagram. These objects can be the nodes, the lines, or the objects you have placed on the diagram (shapes, notes, images). Select those objects that you want to modify and then select the Properties tab in the Toolbox to see the available options. Not all options may be shown.
In many of the properties there is an automatic setting. This allows you to determine if you want the object to inherit the setting or use this setting for this object. If you do not use Automatic then nothing else will impact the setting - not a rule, not a change in the project preferences.
Rules
Now that you understand how you can manipulate the diagram manually GENESYS allows you to set up automatic rules that will do most of the above using a rules framework. You decide what the condition is for an action to take place on the diagram. Then you can switch between rules to see the affect. Maybe you have different phases of your project and you want to overlay them in a presentation. Simply create a rule that identifies the second phase and elide those objects. Then after seeing the first phase, remove the rule and see the second phase layered on top. Or use the rules to show the water, electricity, and power parts of your model in different colors.
But be aware of using too many rules - the rules are evaluated for every update to the diagram. If you find that your performance is suffering you might consider the rule you are using.