Matrix Views
What it is
Matrix Views are a data visualization grid that shows the relationships between entities in a system. The Matrix View feature is a powerful tool for gaining insights into complex systems by providing a customized visual representation of how individual entities are related within a class and scope. In GENESYS, Matrix Views are part of the suite of Independent View types.
Why it’s useful
Use a Matrix View to identify gaps in your project’s traceability or to show traceability coverage. For example, Matrix Views can demonstrate how system requirements are linked to lower-level design requirements, providing a way to visually verify that all requirements are adequately flowed down and connected across different system levels.
Another application example is to use Matrix Views to visually verify that all requirements and functions are allocated to components in the physical architecture. Users have the flexibility to create as many Matrix Views as needed, each dynamically adjustable to include different entities, ensuring that each Matrix View is tailored to meet specific project needs. Matrix Views can help to flag areas where entities may not have been properly related or allocated to other portions of the systems architecture model, providing a visual indication of completeness.
How to use it
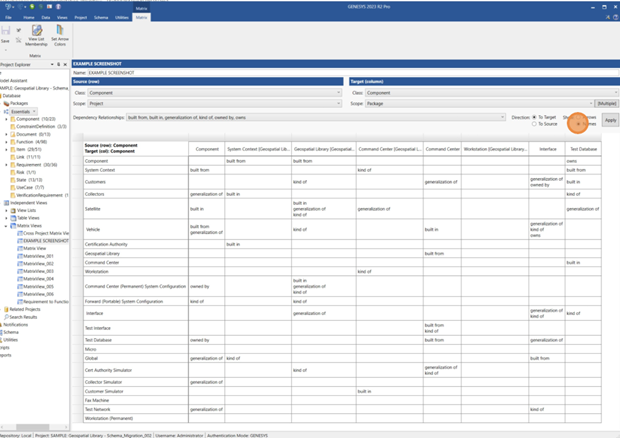
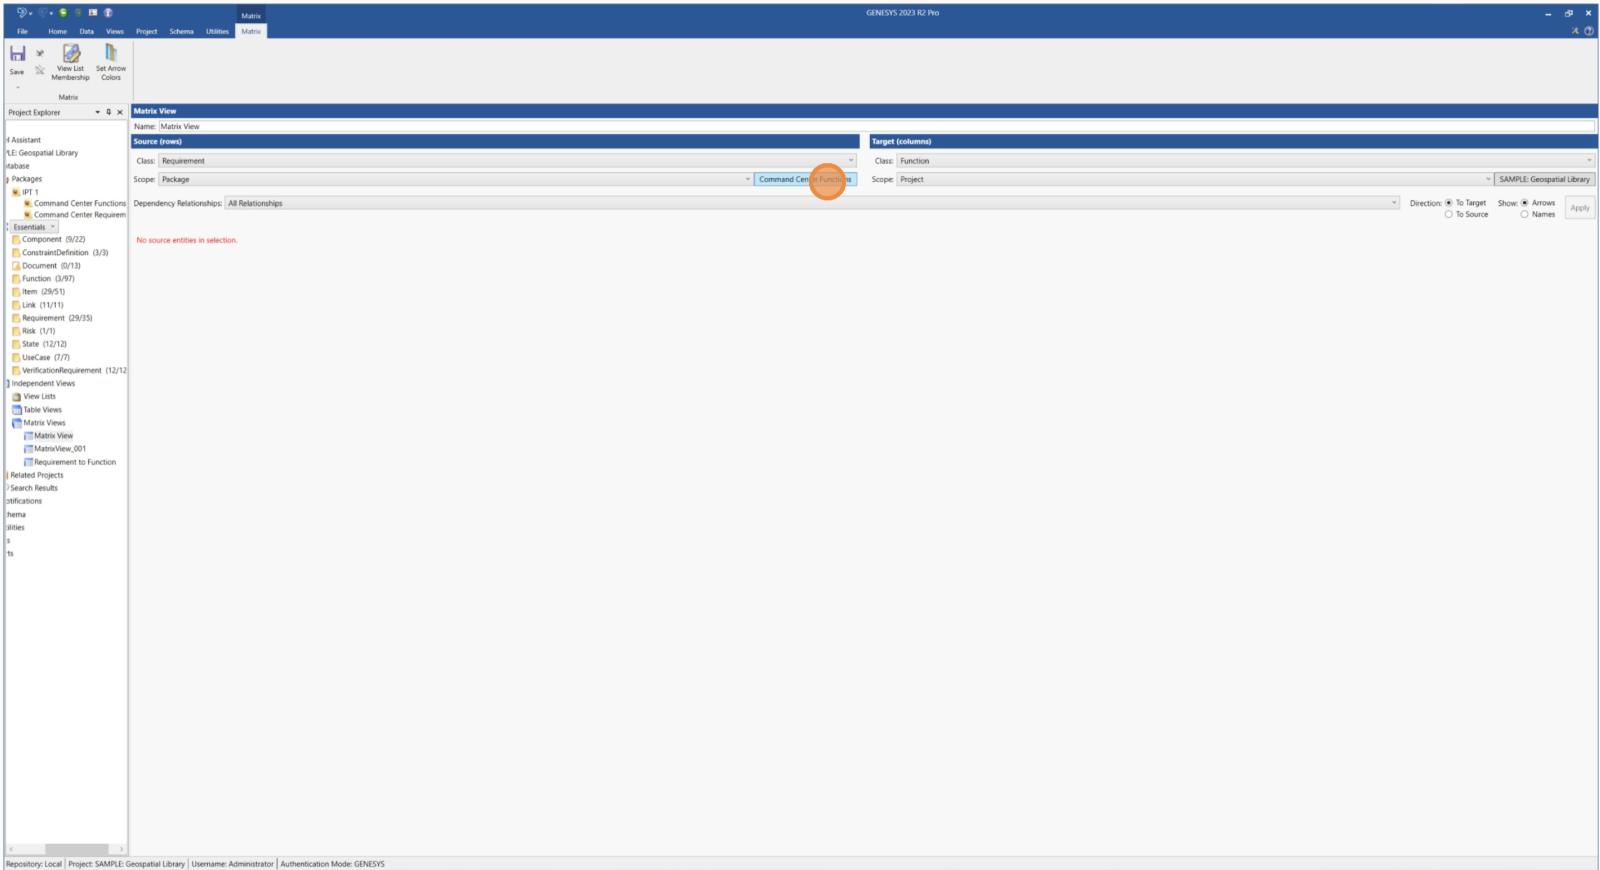
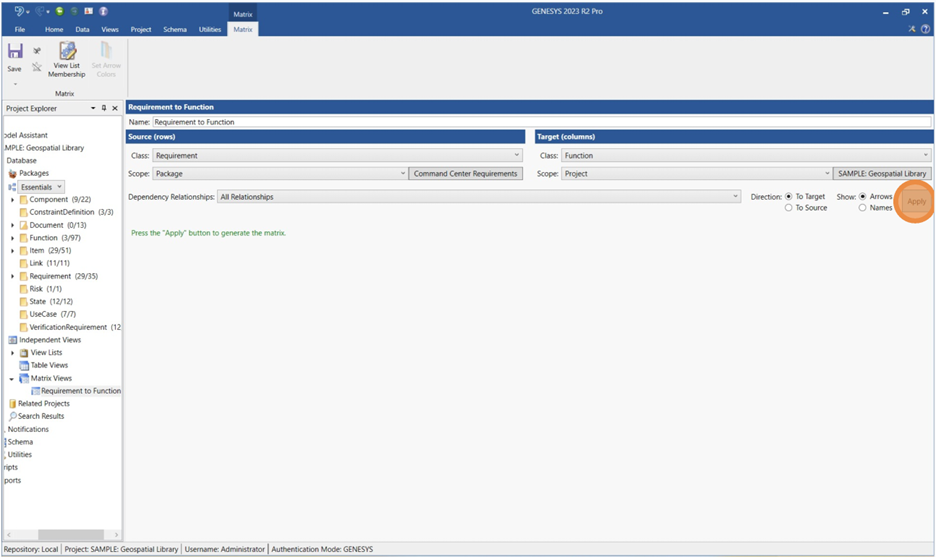
Users specify a class and scope for the rows and columns of the Matrix View and choose which relationships to display in the grid. Matrix Views can display one or more relationship types between a “Source” and a “Target.” These relationships are visualized with color-coded arrows or text strings. The Matrix Views feature has the functionality to edit relationships in real time or remove relationships as needed, allowing users to address any gaps or inconsistencies in requirement coverage immediately. For easy reference, a Matrix View can be exported for use on other platforms.

Create a new Matrix View
-
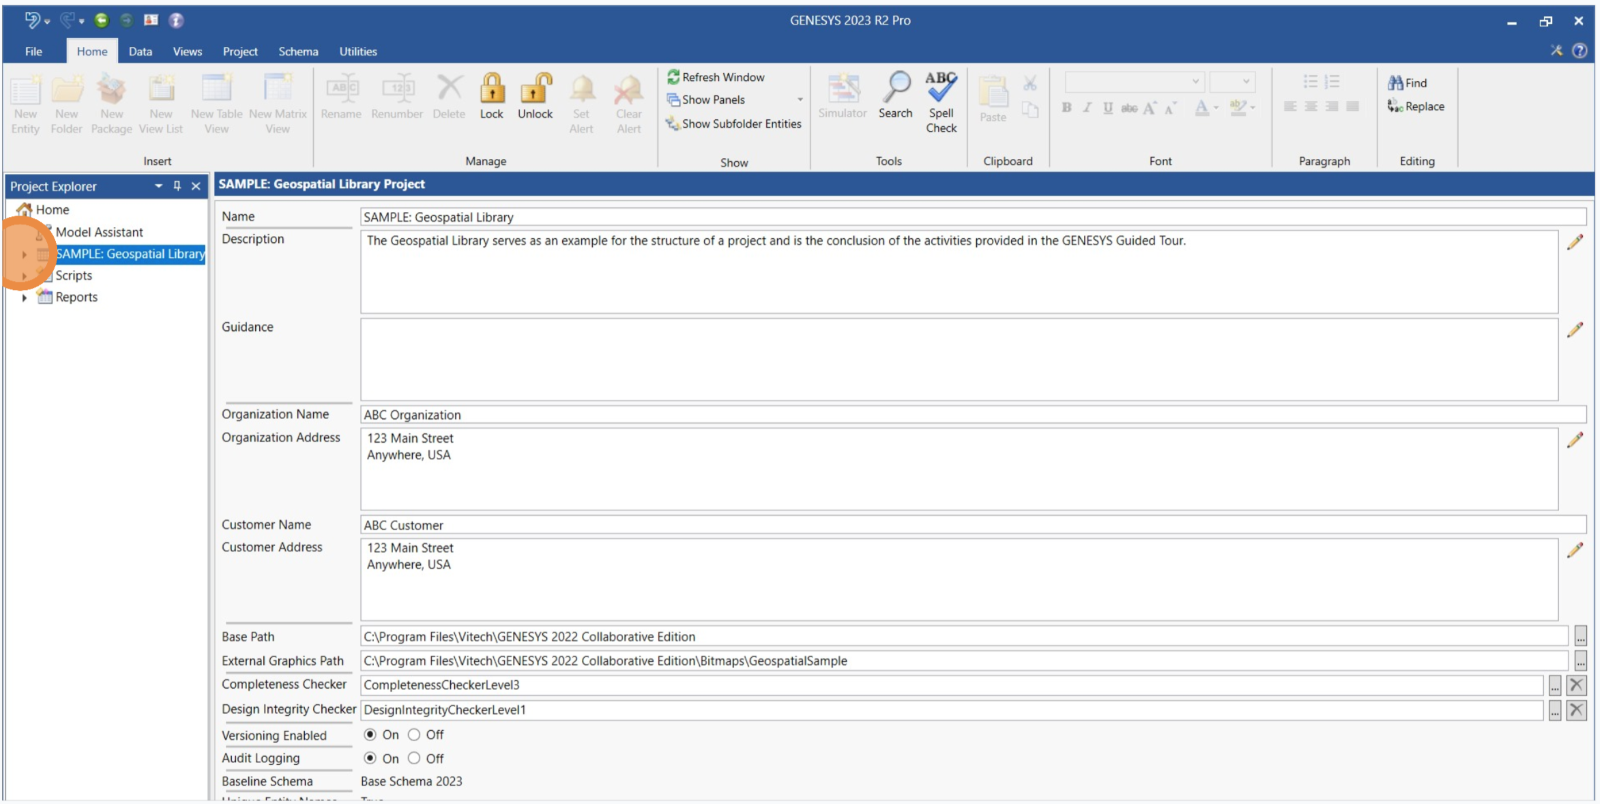
In Project Explorer, double-click your project name.
-
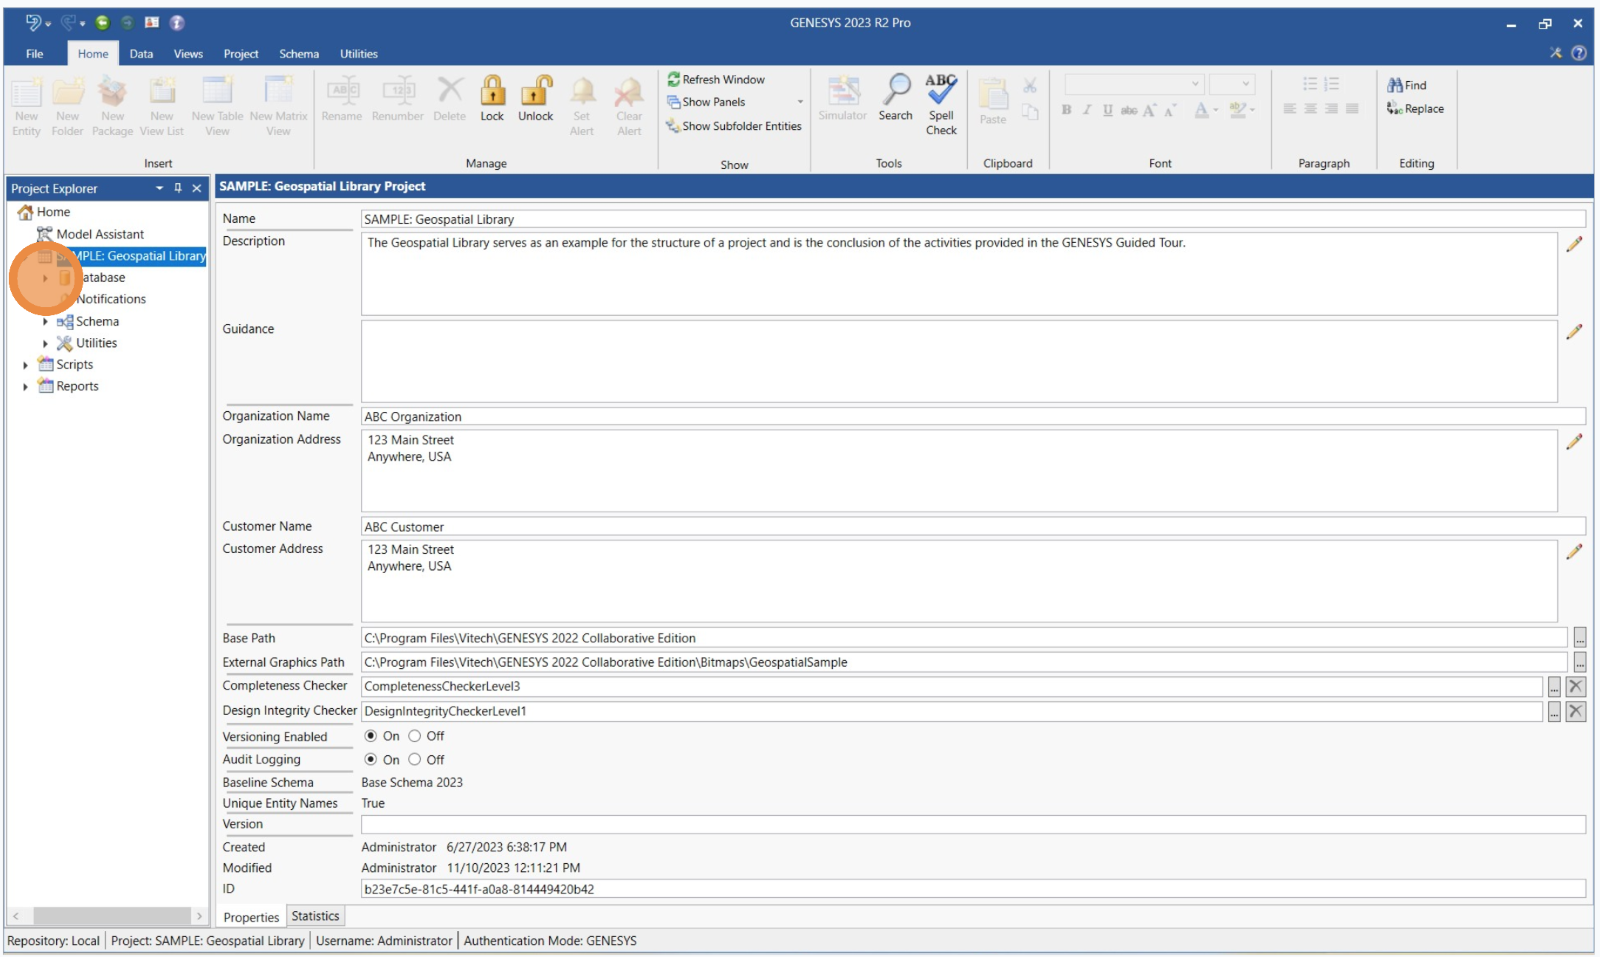
Double-click Database.
-
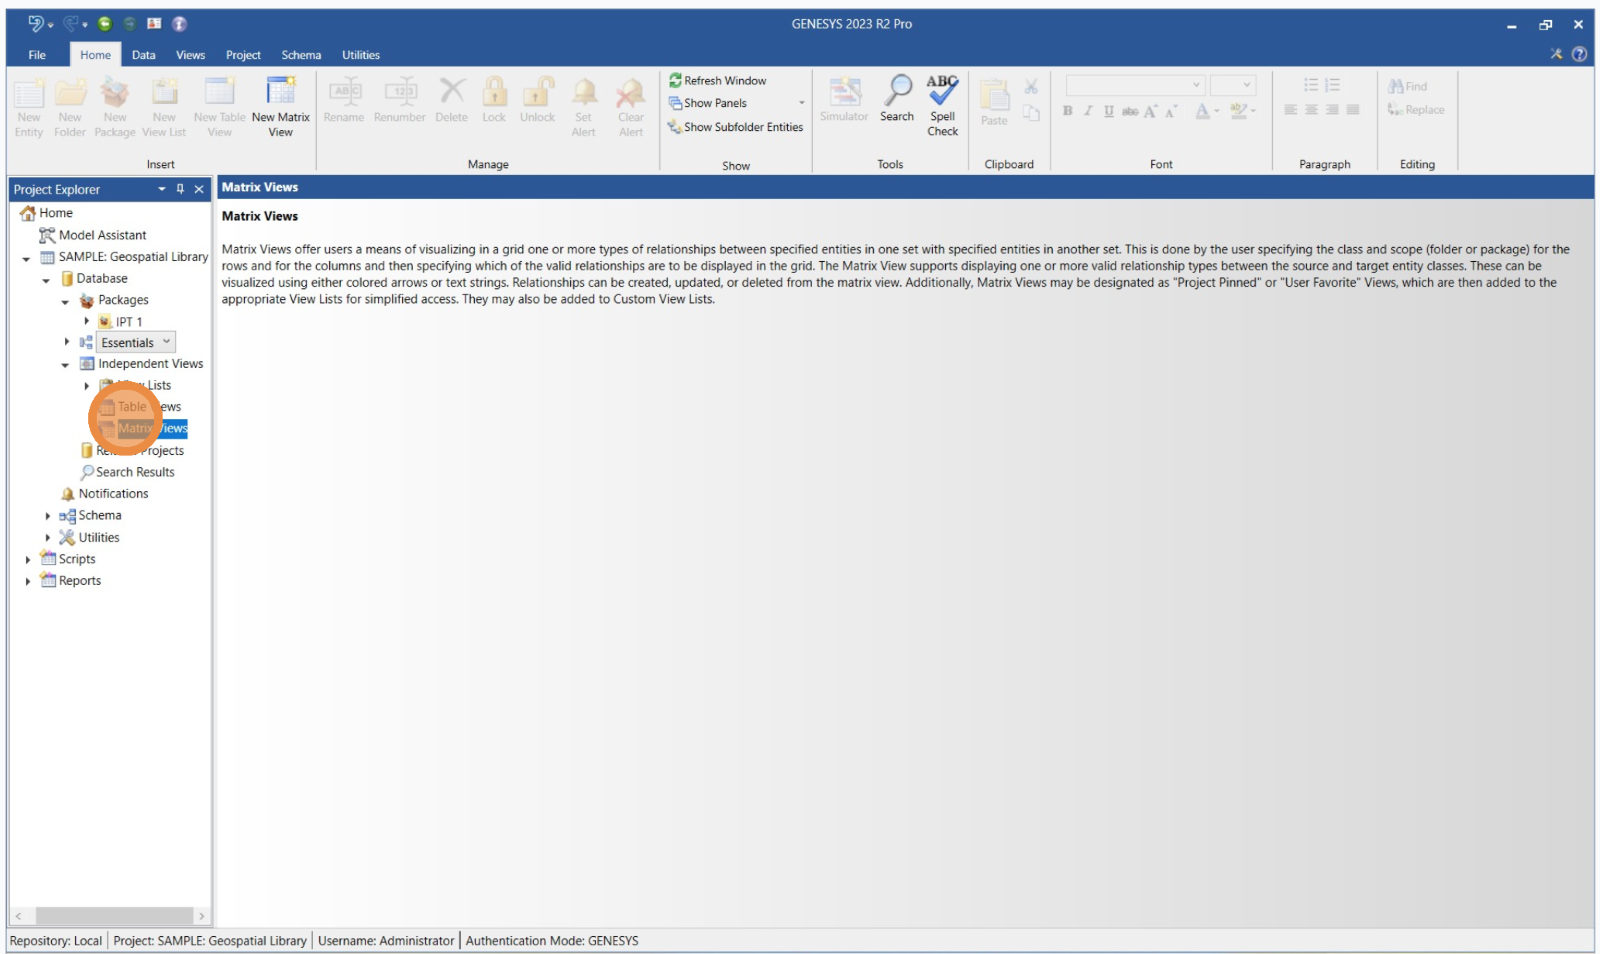
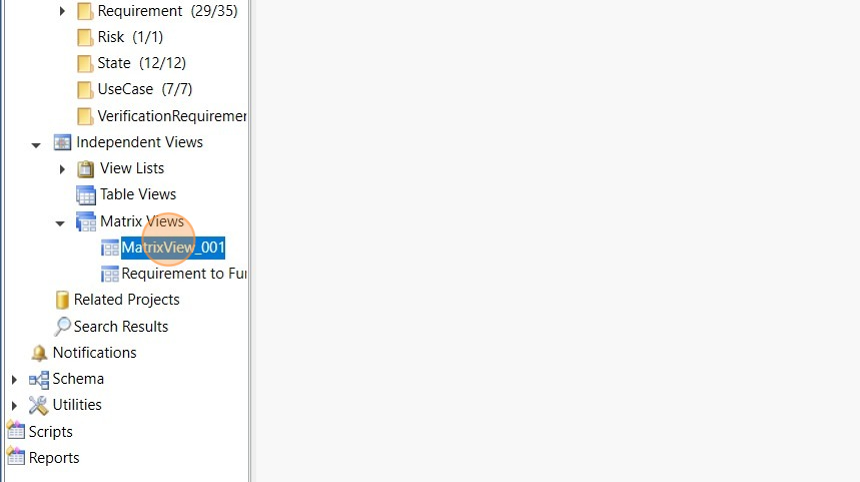
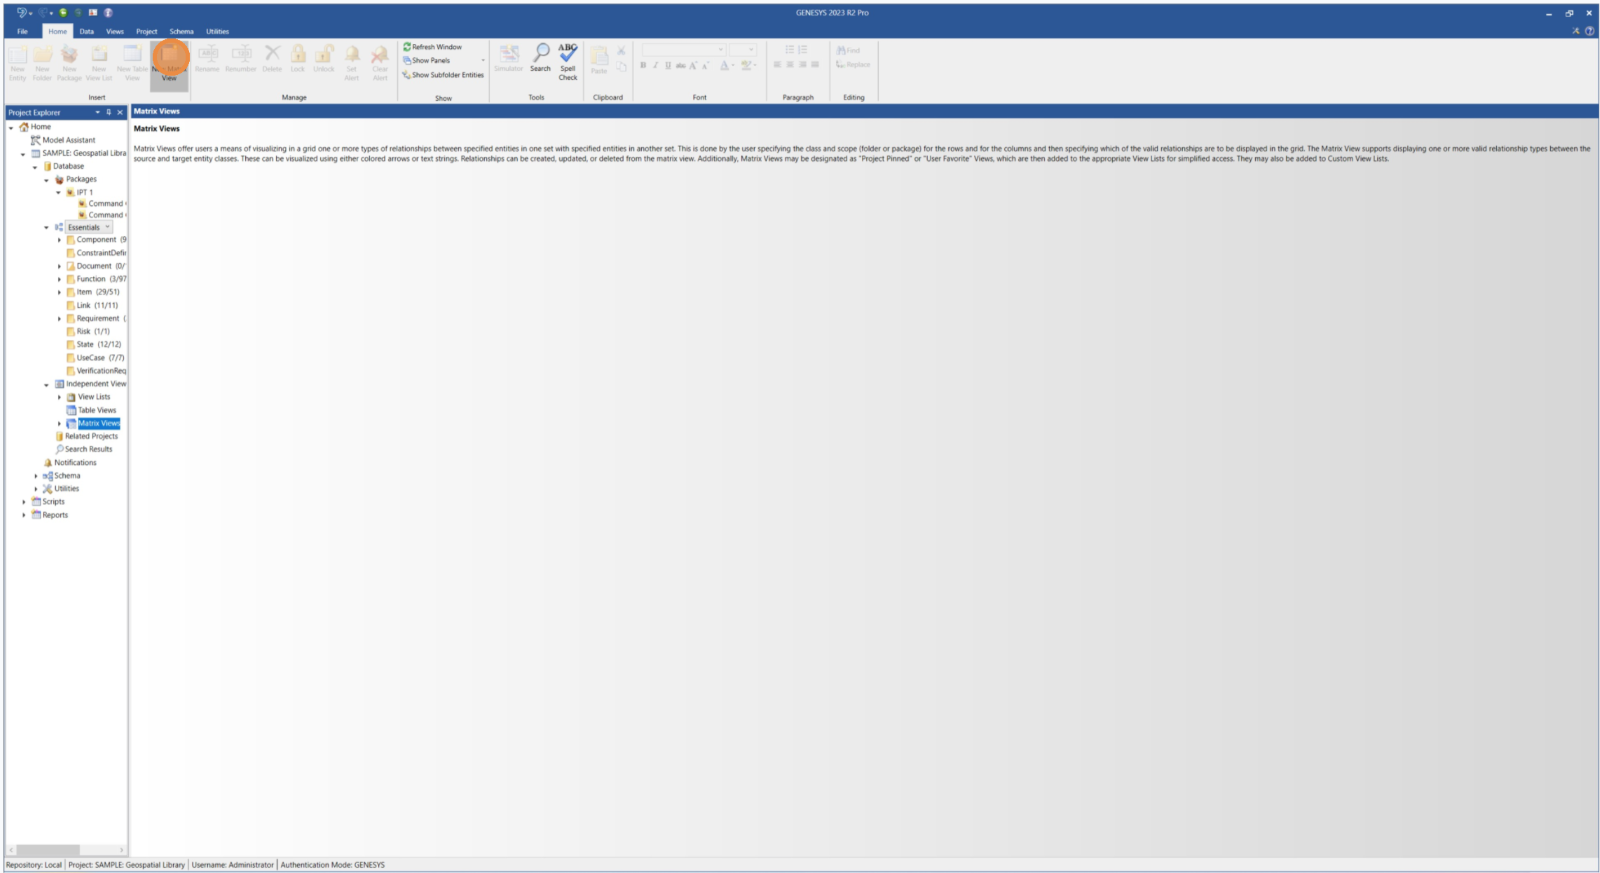
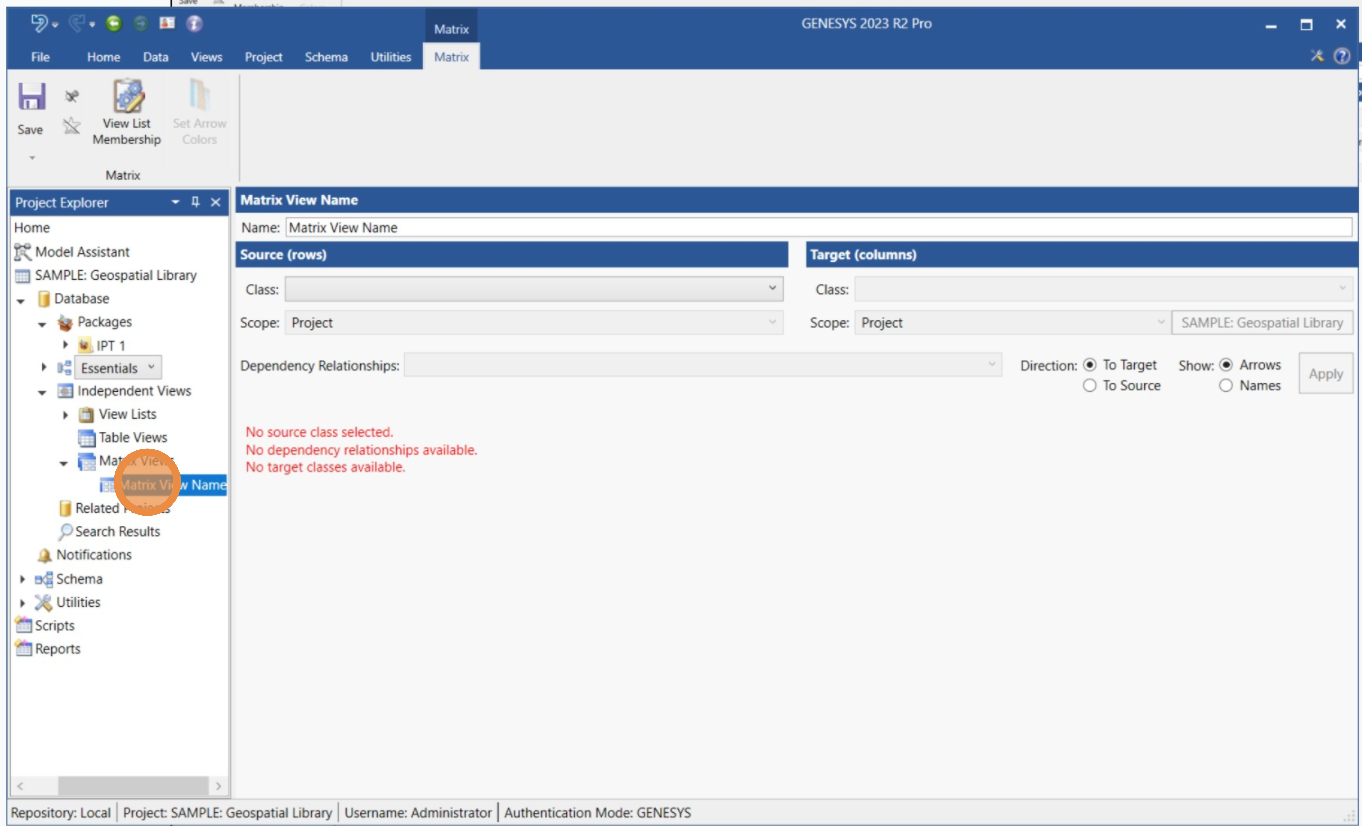
Under “Independent Views,” double-click or right-click Matrix Views
 , or click New Matrix View
  in the ribbon.
-
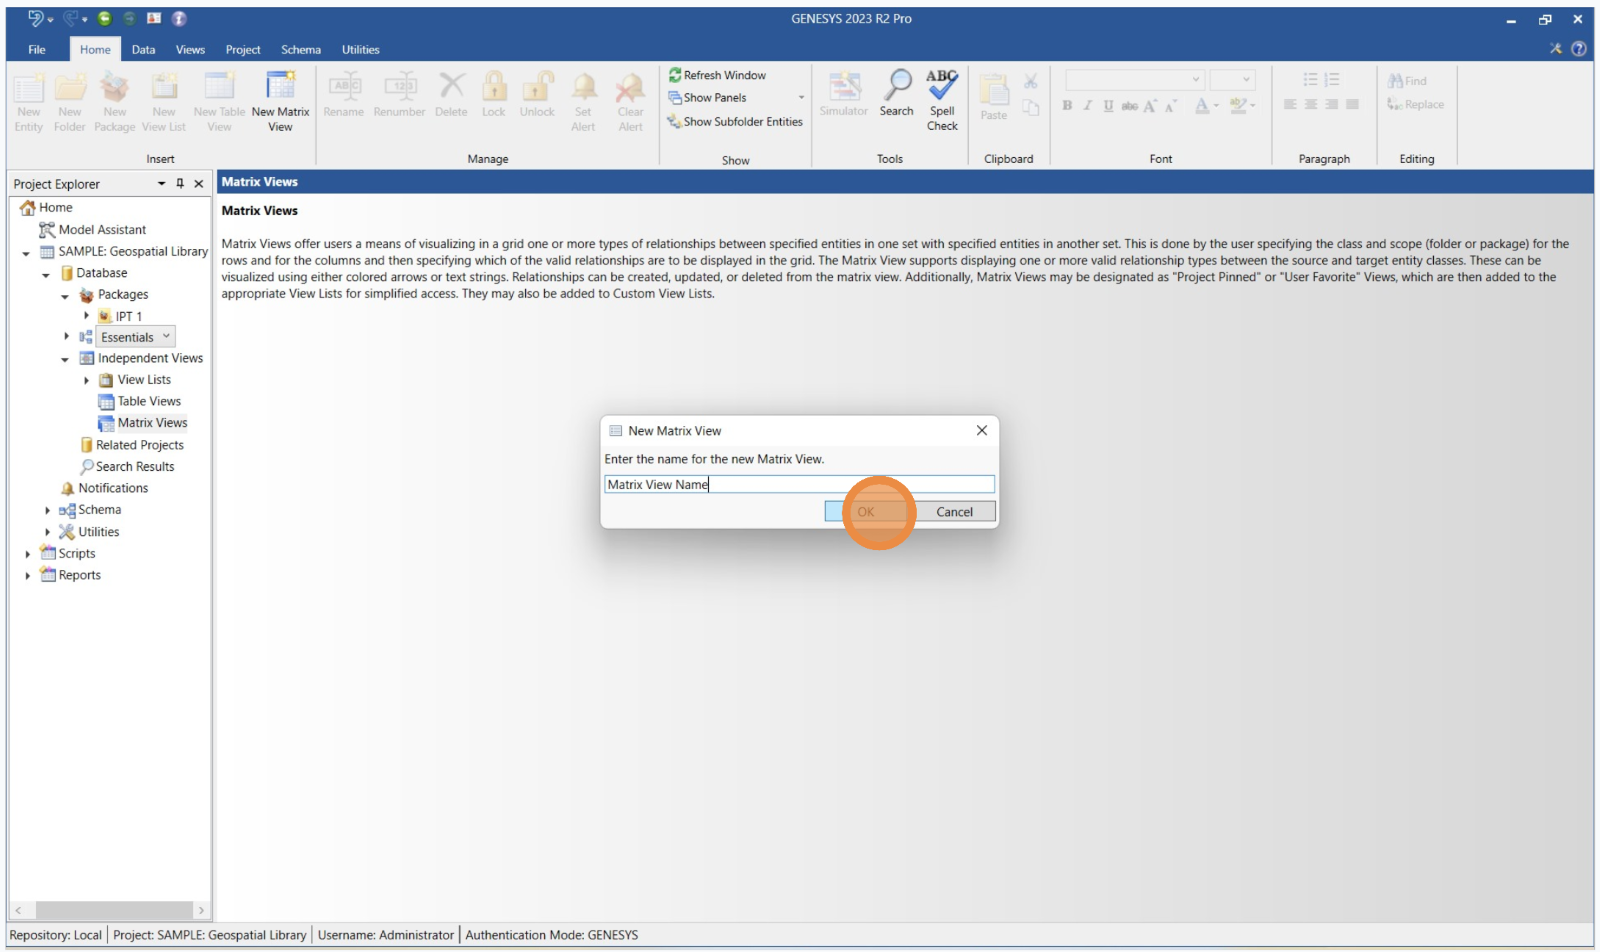
In the “New Matrix View” window, enter a name for your Matrix View > click the OK button.

In Project Explorer, the new Matrix View appears under “Matrix Views.”

Populate a Matrix View
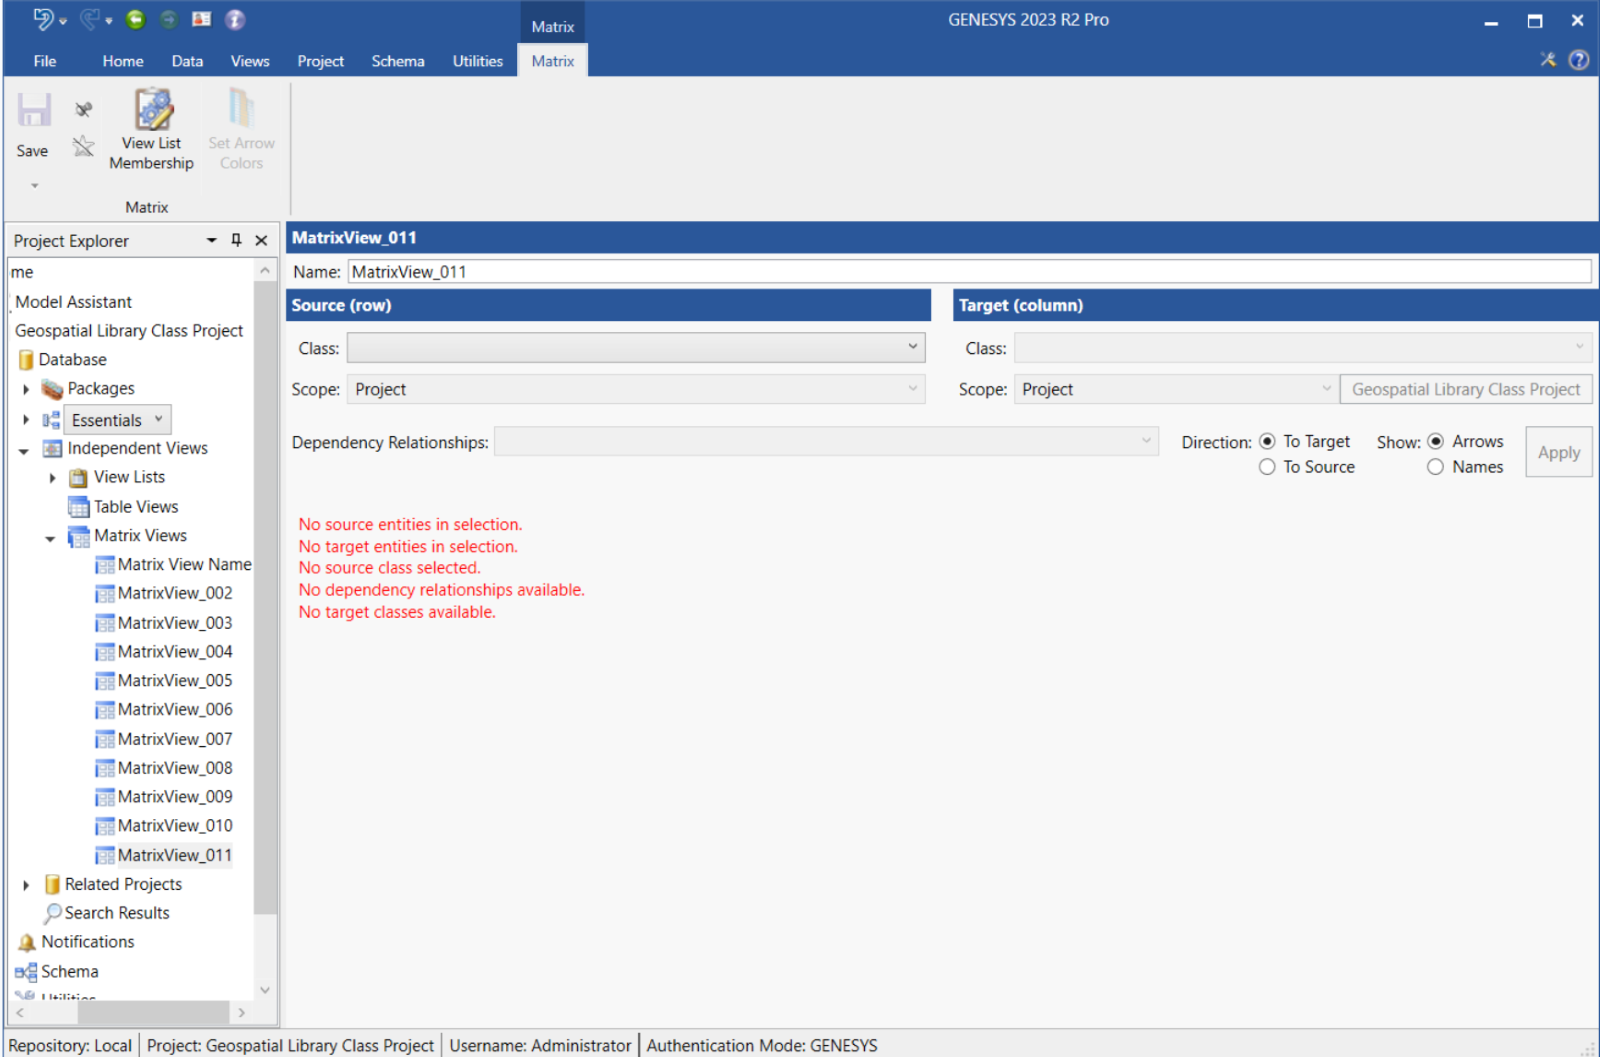
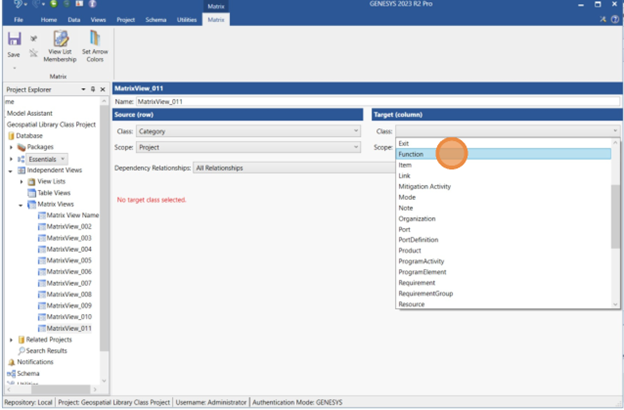
To populate a Matrix View, select a class, scope, and one or more dependency relationships.
-
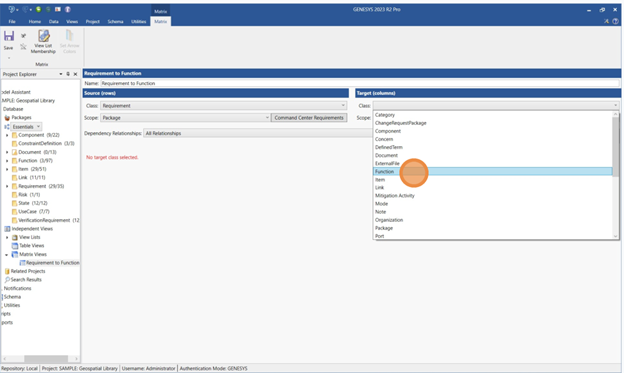
Under “Source (row),” choose a class and scope from the drop-down menus.
-
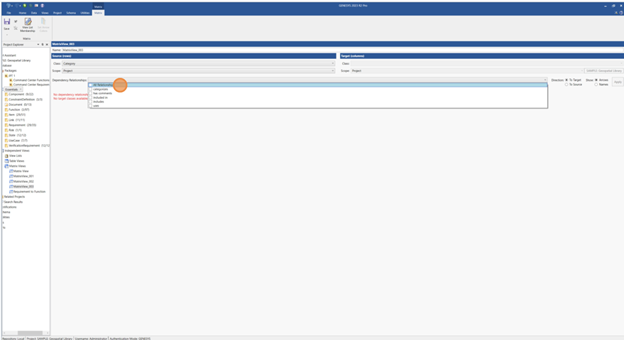
Choose one or more dependency relationships from the drop-down menu.
-
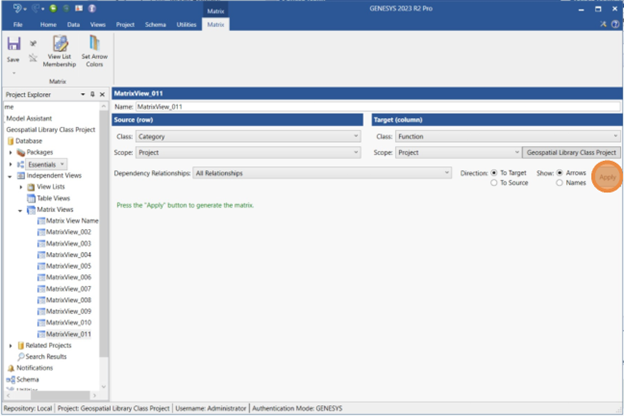
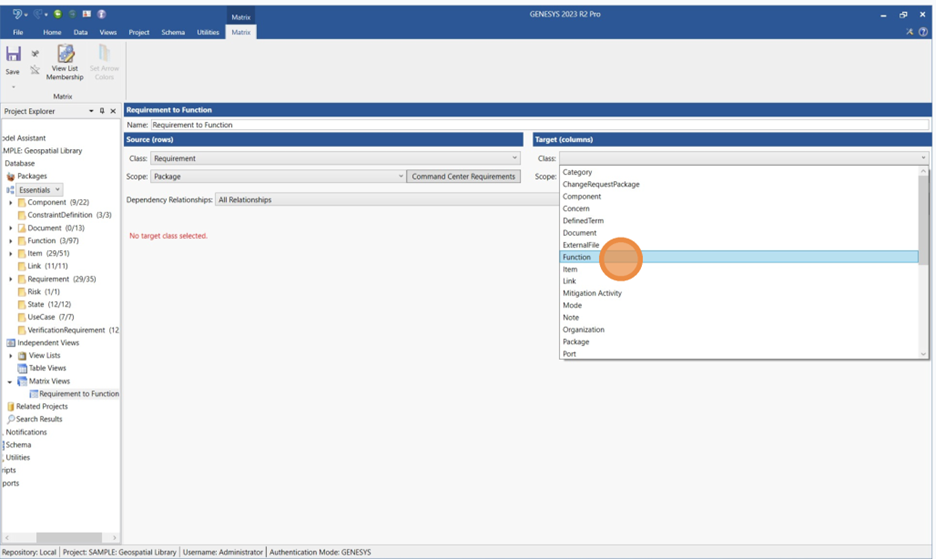
Under “Target (column),” choose a class and scope from the drop-down menus.
-
Click the Apply button.
Change the direction of a Matrix View
-
In the Matrix tab, open the Matrix View of your project.
-
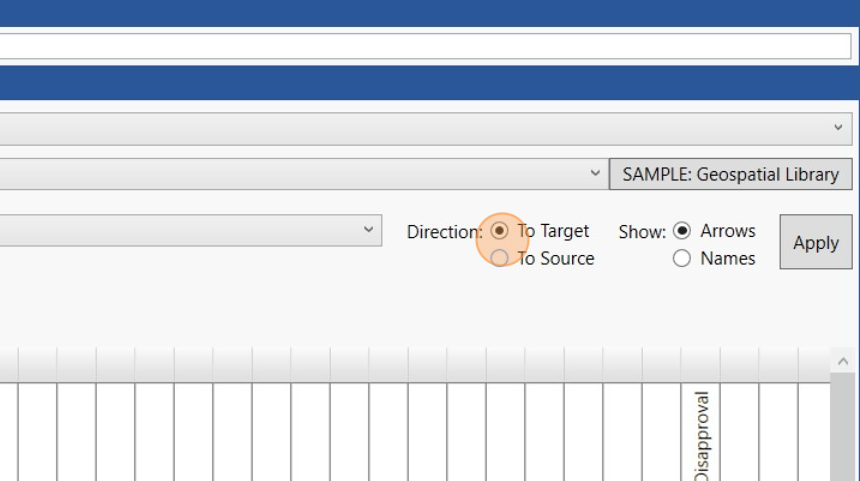
In the upper right of the screen, select “To Target” or “To Source,” as needed.
-
Click the Apply button.
Change the relationship display type
-
In the Matrix tab, open the Matrix View of your project.
-
In the upper right of the screen, select “Arrows” or “Names,” as needed.
-
Click the Apply button.

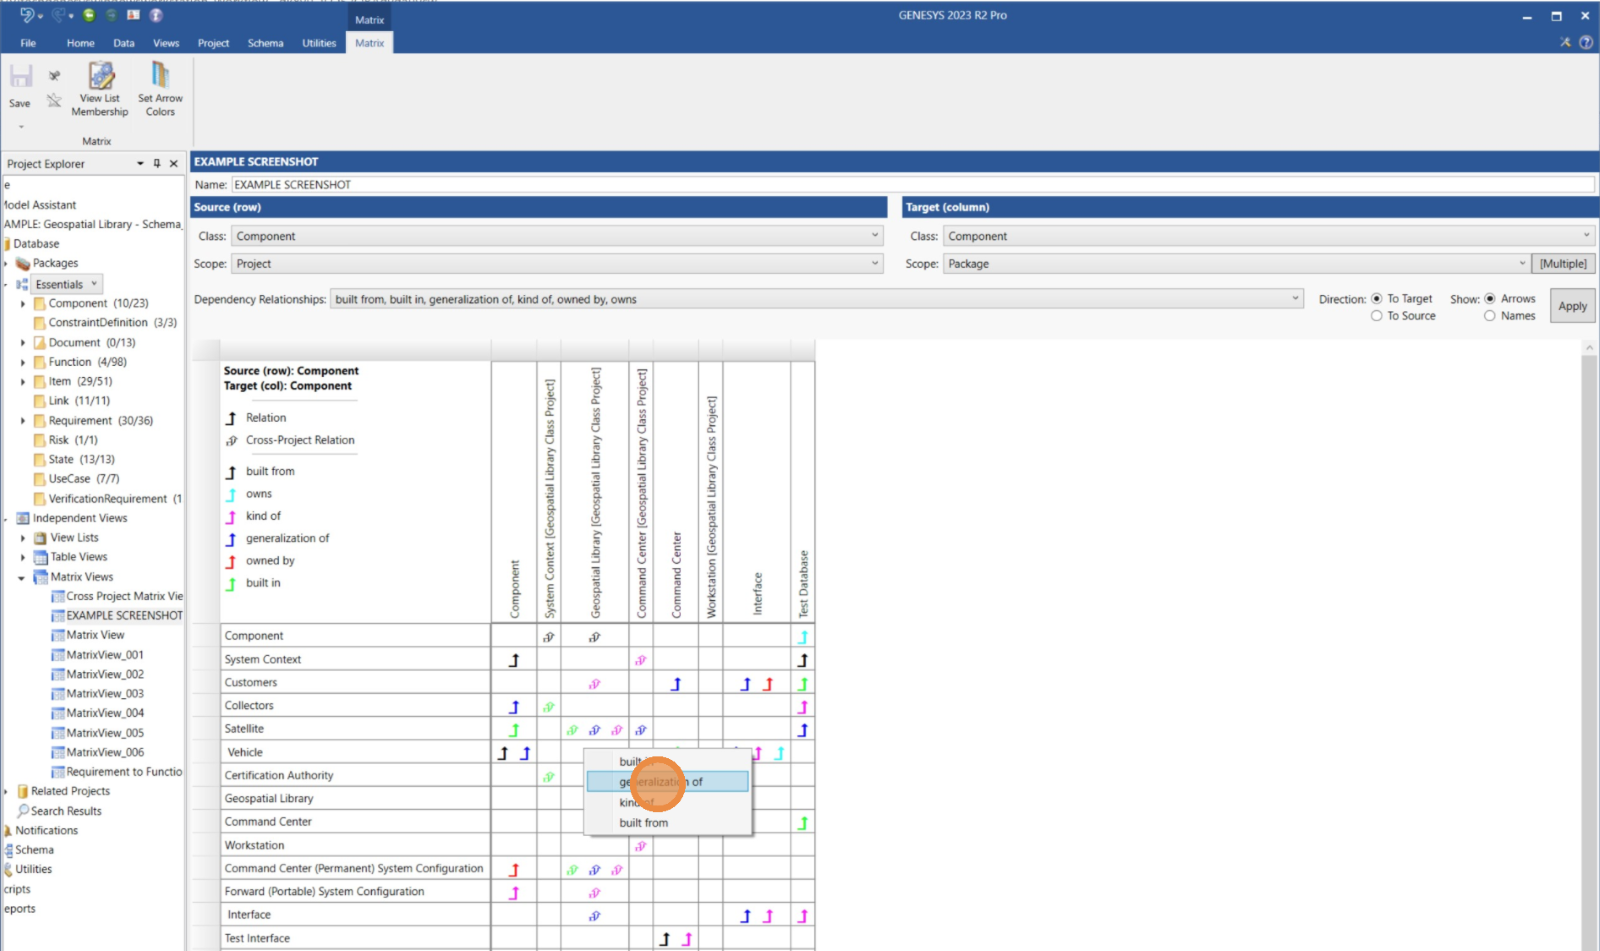
Add dependency relationships
To add or change dependency relationships in a Matrix View, double-click any cell in the Matrix View, then select the dependency relationship you want to add or change.
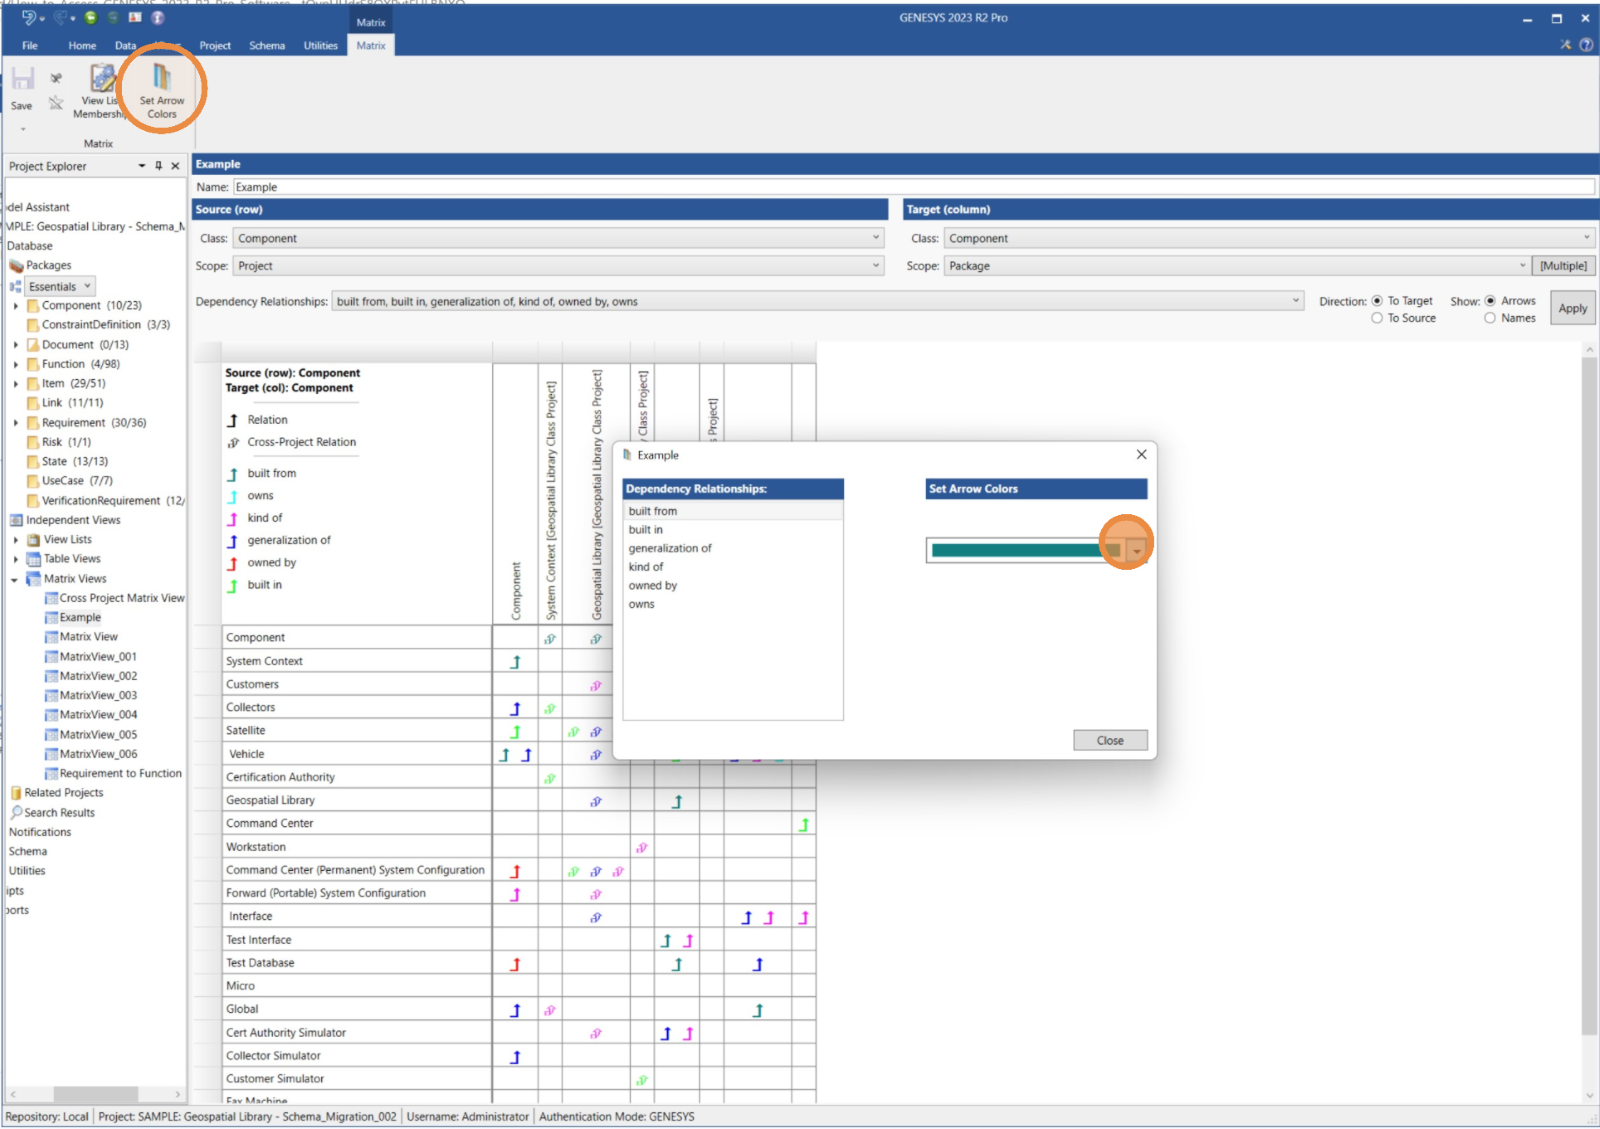
Assign colors to dependency relationship arrows
GENESYS automatically assigns a color to each arrow type in a Matrix View to distinguish between entities. You can also choose up to 10 different colors to assign to arrows.
-
In the Matrix tab, click Set Arrow Colors
 in the ribbon.
-
In the window, under “Dependency Relationships,” click the relationship you want to change.
-
Under “Set Arrow Colors,” choose a color from the drop-down menu.
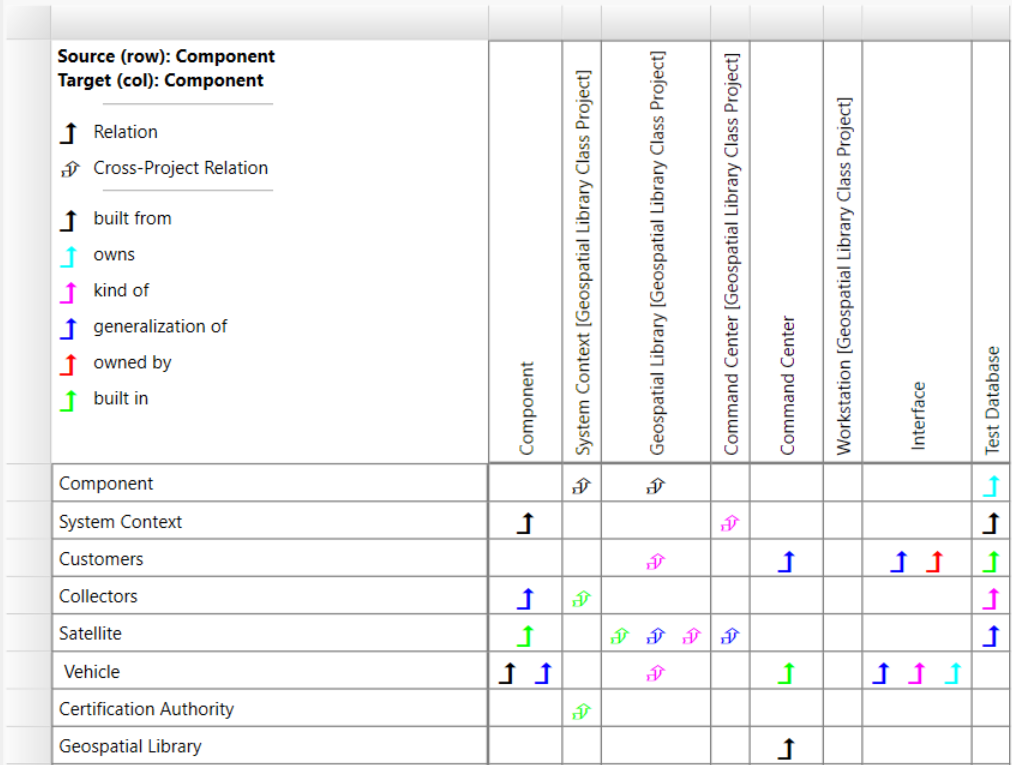
Matrix View legend
In the Matrix View, there is a legend in the upper left corner. It displays the names, colors, and types of relationships for each dependency relationship in the Matrix View. The legend is divided into two sections by a line. Above the line, it displays arrow styles: a solid arrow represents a relationship, and a hollow arrow represents a cross-project relationship. Below the line, the legend shows each arrow color and its corresponding relationship type in the Matrix View.
Jump to an entity in a Matrix View
To expand and view an entity, right-click on the entity in Matrix View.
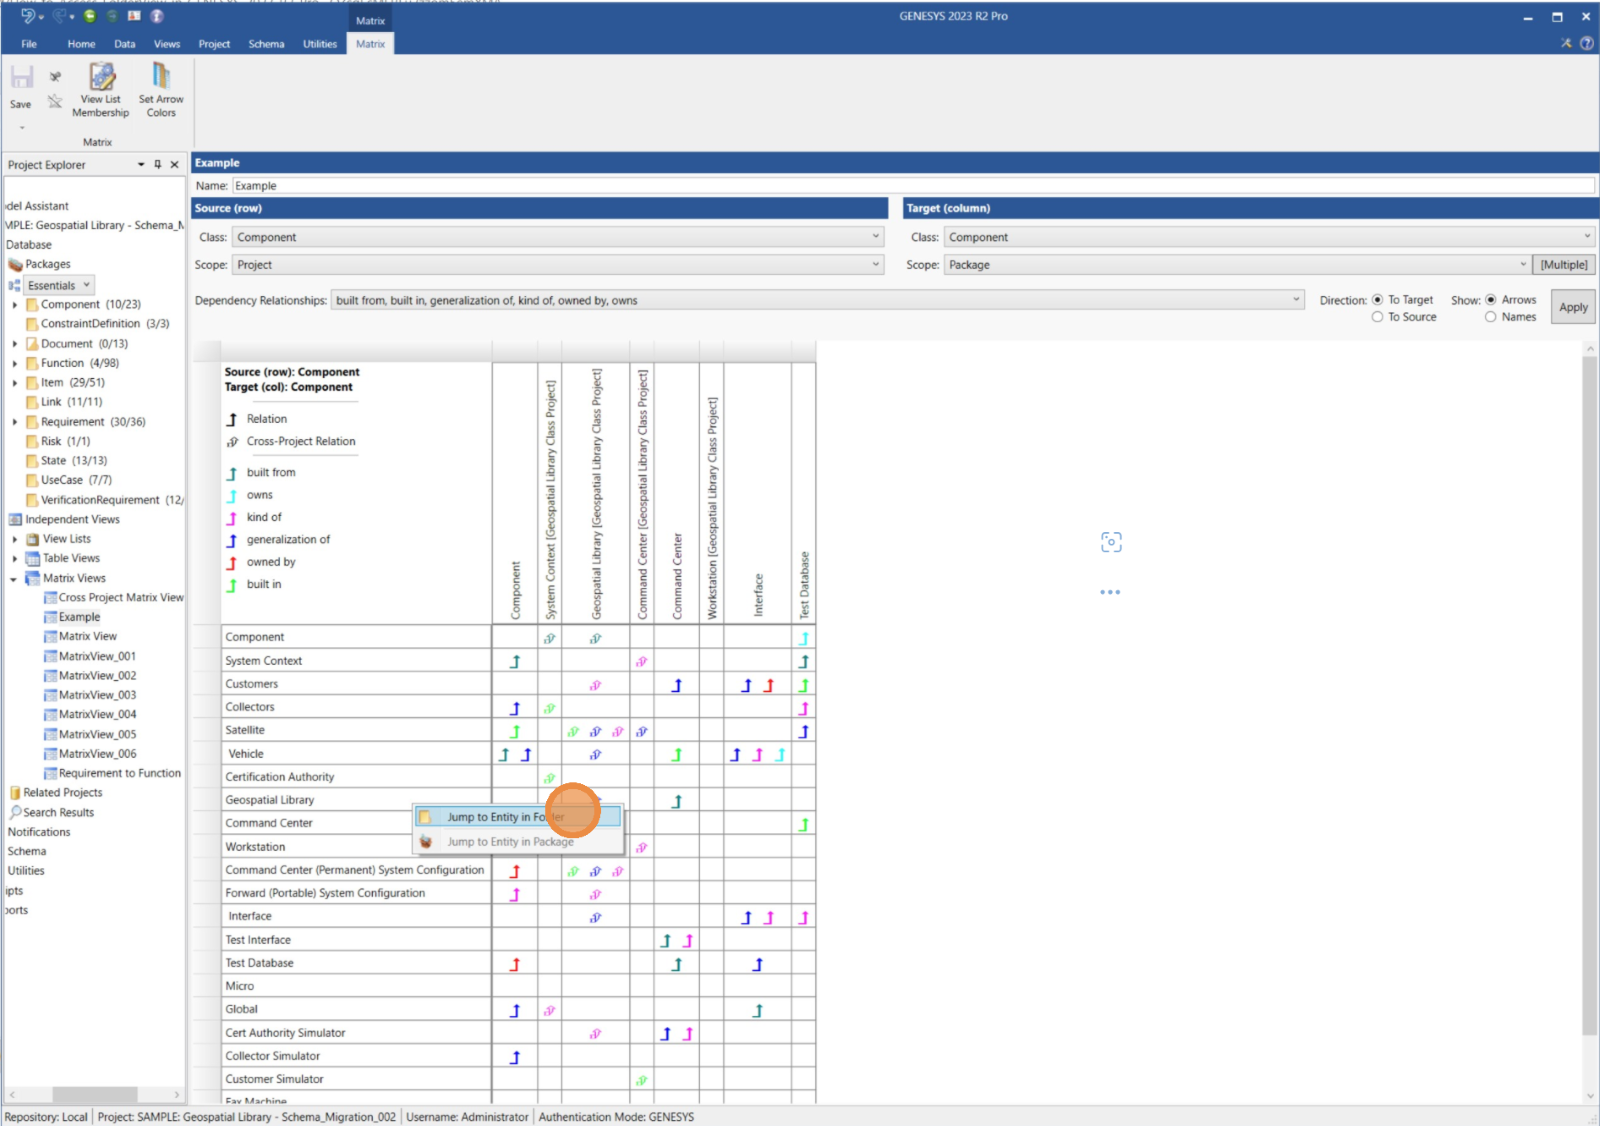
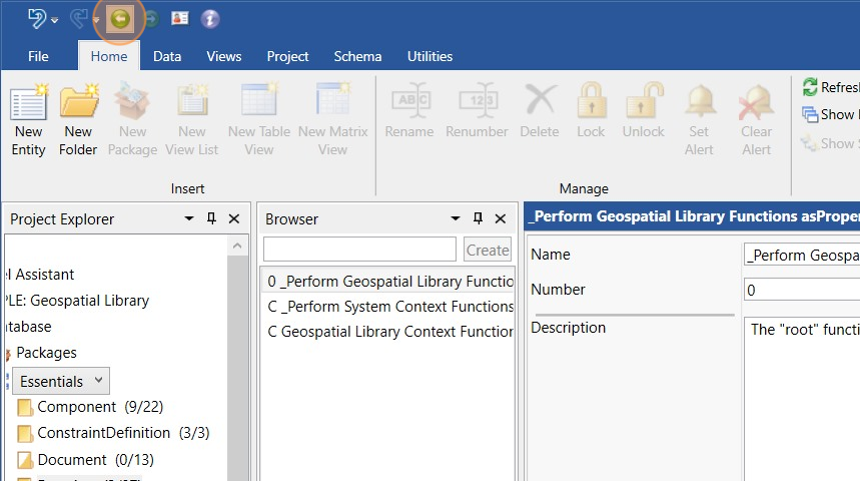
To navigate back to the Matrix View from the entity’s property sheet, click the back button  in the upper left corner.
Delete a Matrix View
-
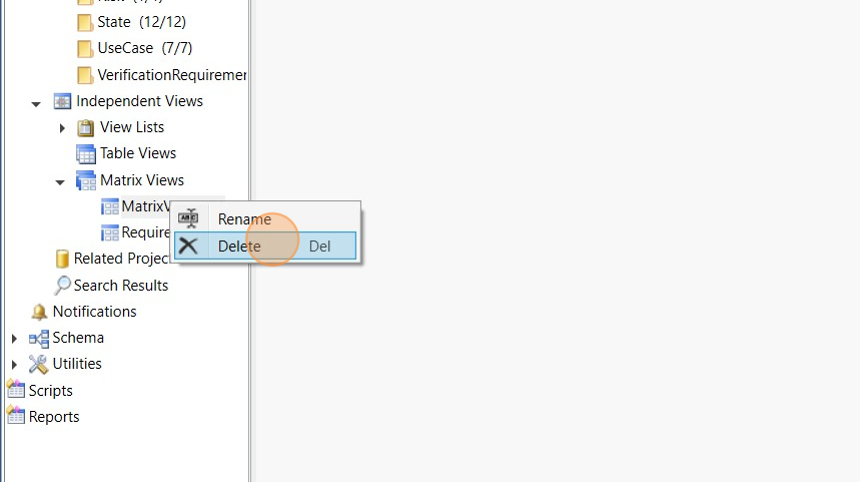
In Project Explorer, right-click on the name of the Matrix View.
-
Click Delete.
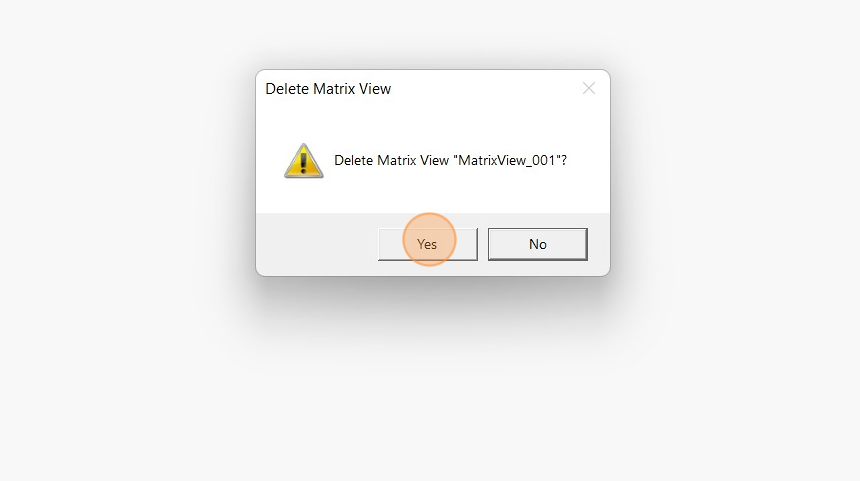
-
In the “Delete Matrix View” window, click the Yes button.
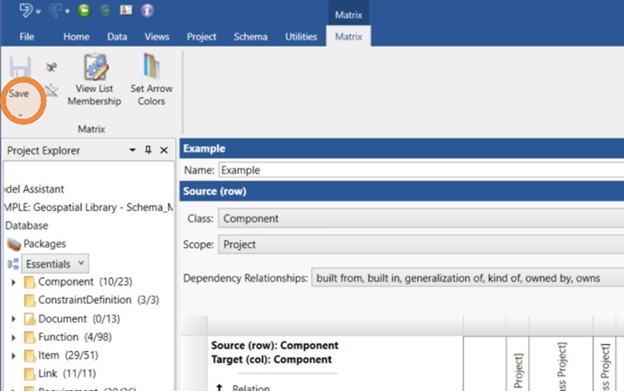
Export a Matrix View
You can export a Matrix View as an Excel file or as an image.
-
In the upper left of the Matrix View ribbon, click Save.
-
Click Save As Excel to save the Matrix View as a .xlsx file.
-
Click Save As Image to save the Matrix View as a GIF, JPEG, PNG, TIFF, or Bitmap image file.
Create a Package Matrix View
In GENESYS, a Package can contain diagrams, entities, and other Packages, creating a nested structure with a user-defined grouping. You can create a Matrix View that uses a Package as its scope.
-
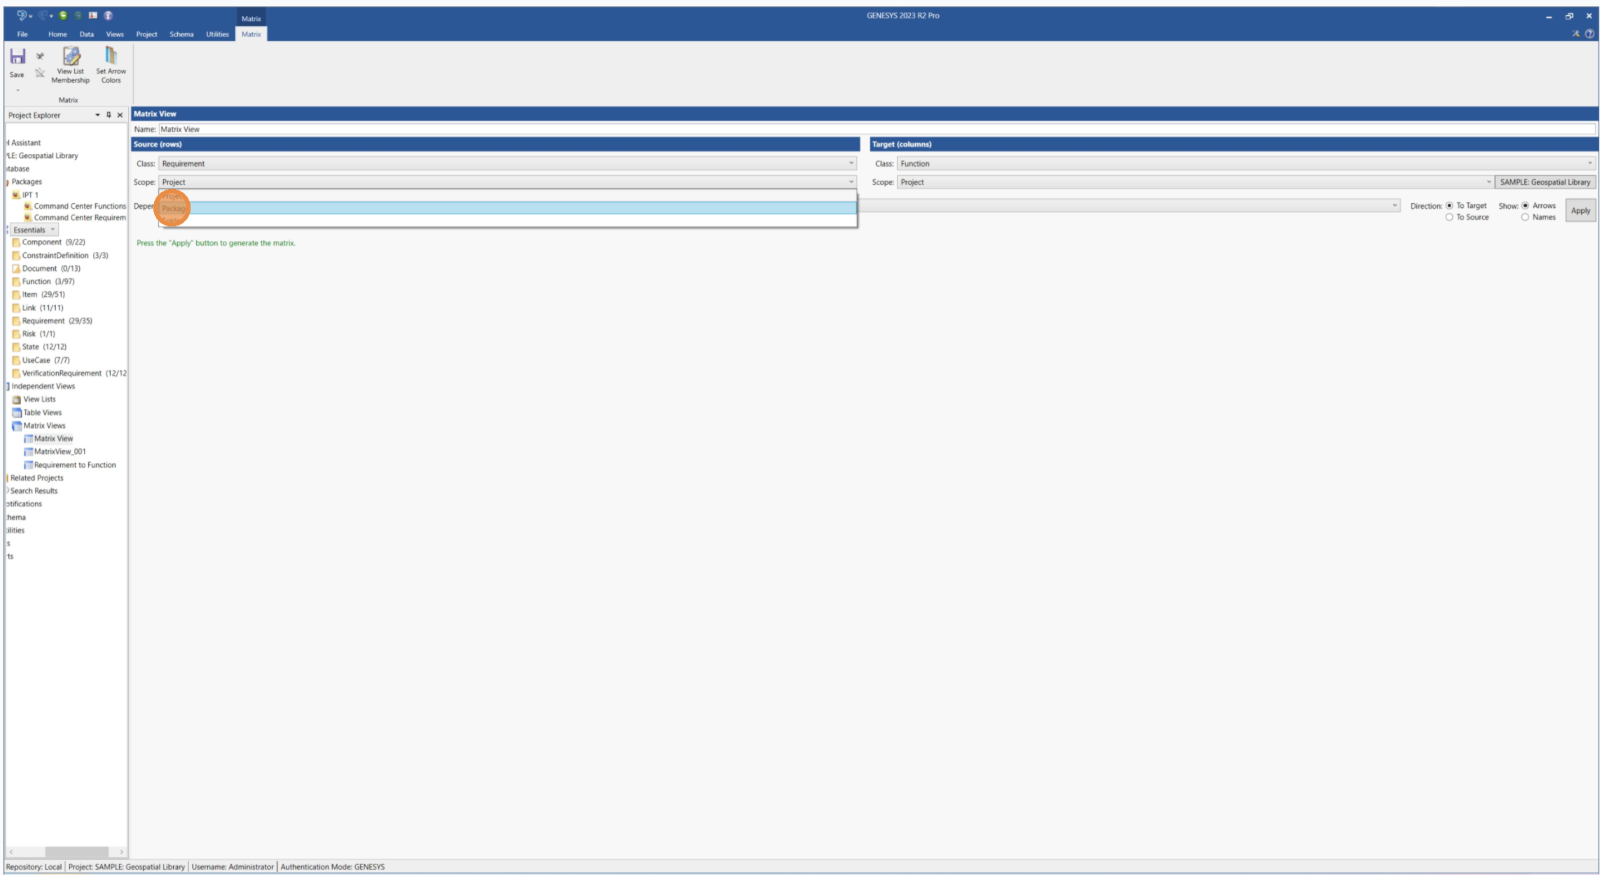
In a Matrix View, select a class in the “Source (row)” section.
-
In the “Scope” drop-down menu, select “Package.”
-
In the “Select Package For Filter Scope” window, select a source Package.
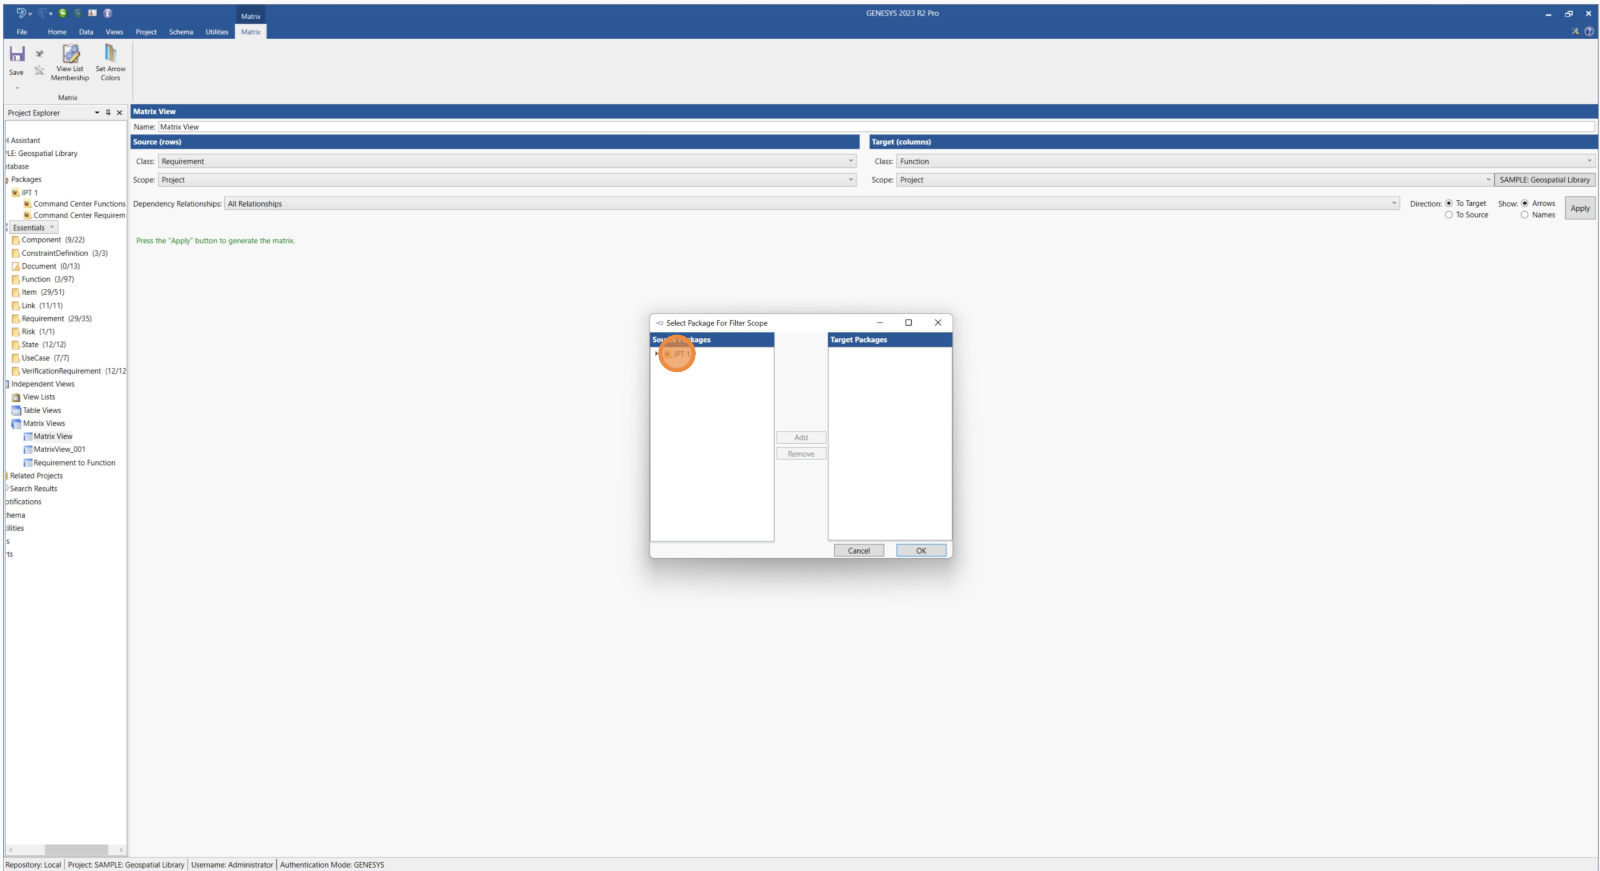
4. In the “Select Package For Filter Scope” window, click the Add button to add one or more Packages > click the OK button.
-
To change the Package selection for the Matrix View, click the button with the package's name under “Source (row).”
Create a project Matrix View
A Matrix View can be used for project-wide data visualization. You can create a Matrix View that uses a project as its scope.
-
In Project Explorer, click Matrix Views.
-
In the ribbon, click New Matrix View
-
In the “New Matrix View” window, enter a name for your Matrix View > click the OK button.
-
In Project Explorer, the new Matrix View appears under “Matrix Views.”

-
Under “Source (row),” choose a class from the drop-down menu.
-
In the “Scope” drop-down menu, choose “Project.”
-
In the “Dependency Relationships” drop-down menu, choose one or more dependency relationships to show in the Matrix View.

-
Under “Target (column),” choose a class and scope from the drop-down menus.
-
Click the Apply button.
Create a folder Matrix View
You can use a selected folder to build a Matrix View.
-
In Project Explorer, click Matrix Views.
-
In the ribbon, click New Matrix View
-
In the “New Matrix View” window, enter a name for your Matrix View > click the OK button.

-
In Project Explorer, the new Matrix View appears under “Matrix Views.”
-
Under “Source (row),” choose a class from the drop-down menu.
-
In the “Scope” drop-down menu, choose “Folder.”
-
In the “Select Folder For Filter Scope” window, select the source folders you want to use in the Matrix View.
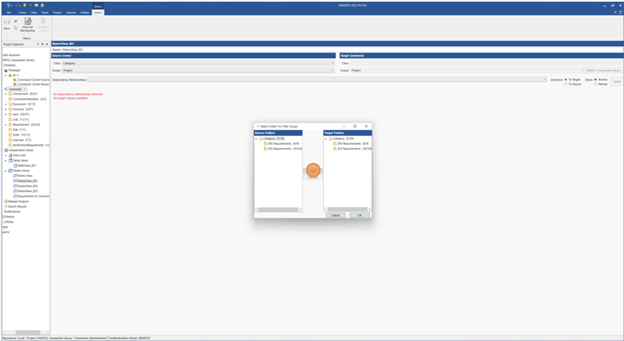
8. Click the Add button > OK button.
9. In the “Dependency Relationships” drop-down menu, choose one or more dependency relationships to show in the Matrix View.
-
Under “Target (column),” choose a class and scope from the drop-down menus.
-
Click the Apply button.
-
Click the button that appears to the right of the “Scope” drop-down in the "Source (row)" section to edit your source folder selection.
Note: The button shows the name of the Matrix View’s current folder selection. For example, if the selected folder is “Requirement,” the button displays “Requirement.”


Create cross-project Matrix Views
You can visualize dependency relationships across multiple projects in GENESYS with a cross-project Matrix View. To use this feature, open two projects in GENESYS to compare. In this type of Matrix View, the source (row) shows the primary project and the target (column) shows the secondary project.
Create a cross-project Matrix View using a folder
-
Open a project in GENESYS.
-
Open a second project in GENESYS to compare to the first project.
-
Create a new Matrix View.
-
In the “Class” drop-down menu under the “Source (row)” section, choose a class type.
-
In the “Scope” drop-down menu under the “Source (row)” section, click "Folder."
Note: Folders from a second project can only be selected in the target column.
-
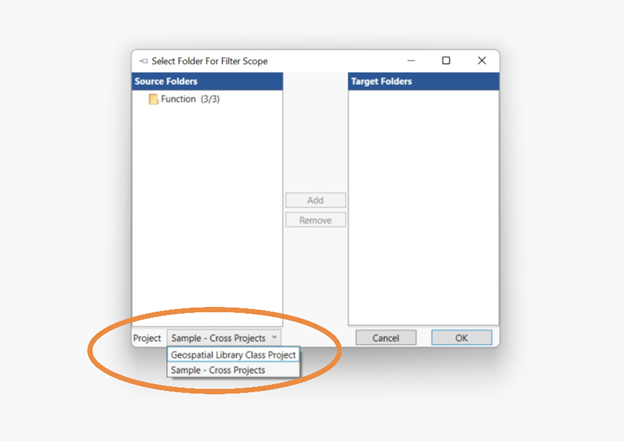
In the “Select Folder For Filter Scope” window, select one or more folders from “Source Folders” to add to “Target Folders” > click the Add button > OK button.
-
In the “Dependency Relationships” drop-down menu, choose one or more dependency relationships.
-
Choose a class type and a scope in the “Target (column)” section.
-
In the “Select Folder For Filter Scope” window, select the second project from the “Project” drop-down menu at the bottom left.
Note: Only projects that are currently open in GENESYS are displayed in the drop-down menu.
-
In the “Select Folder For Filter Scope” window, select one or more cross-project folders from “Source Folders” to add to “Target Folders.”
-
Click the Add button > OK button > Apply button.
Note: In the target "Select Folder For Filter Scope" window, folders belonging to the second project are identified by blue font.
Create a cross-project Matrix View using a package
-
Open a project in GENESYS.
-
Open a second project in GENESYS to compare to the first project.
-
Create a new Matrix View.
-
In the “Class” drop-down menu under the “Source (row)” section, choose a class type.
-
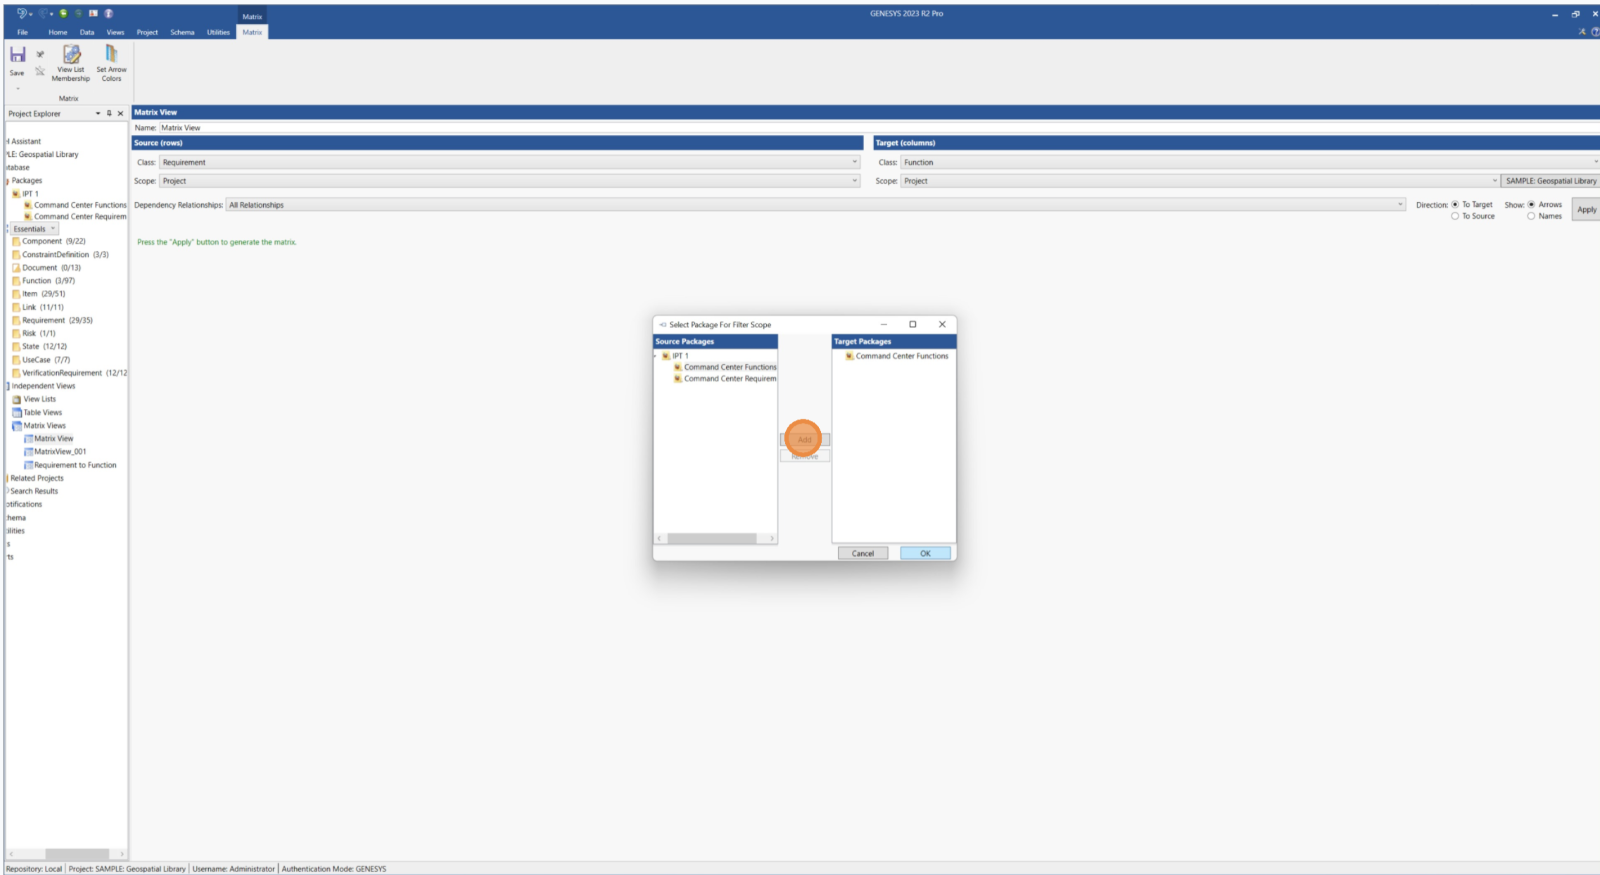
In the “Scope” drop-down menu under the “Source (row)” section, click "Package."
-
In the “Select Package For Filter Scope” window, select one or more source packages to add to the target packages > click the OK button.
-
In the “Dependency Relationships” drop-down menu, choose one or more dependency relationships.
-
Choose a class type and a scope type in the “Target (column)” section.
-
In the “Select Package For Filter Scope” window, select the second project from the “Project” drop-down menu at the bottom left.
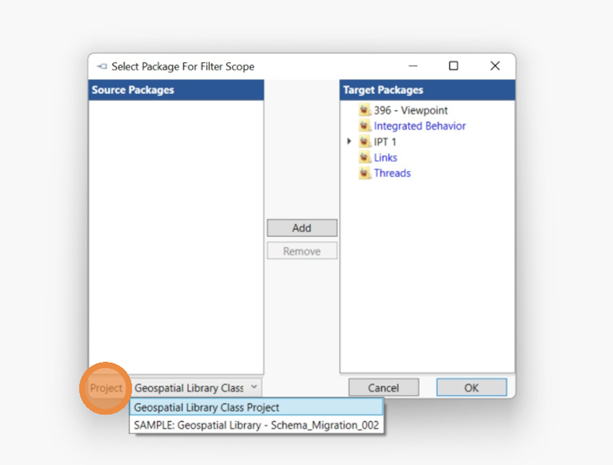
Note: Only projects that are currently open in GENESYS are displayed in the drop-down menu.
-
In the “Select Package For Filter Scope” window, select one or more cross-project folders from “Source Packages” to add to “Target Packages.”
-
Click the Add button > OK button > Apply button.
Note: In the target "Select Package For Filter Scope" window, packages belonging to the second project are identified by blue font.
Create a project–project Matrix View
-
Open a project in GENESYS.
-
Open a second project in GENESYS to compare to the first project.
-
Create a new Matrix View.
-
Ensure that the scope is set to “Project” under the “Source (row)” and “Target (column)” sections.
-
In the “Class” drop-down menu under the “Source (row)” section, choose a class.
-
In the “Dependency Relationships” drop-down menu, choose one or more dependency relationships.
-
In the “Class” drop-down menu under the “Target (column)” section, choose a class.
-
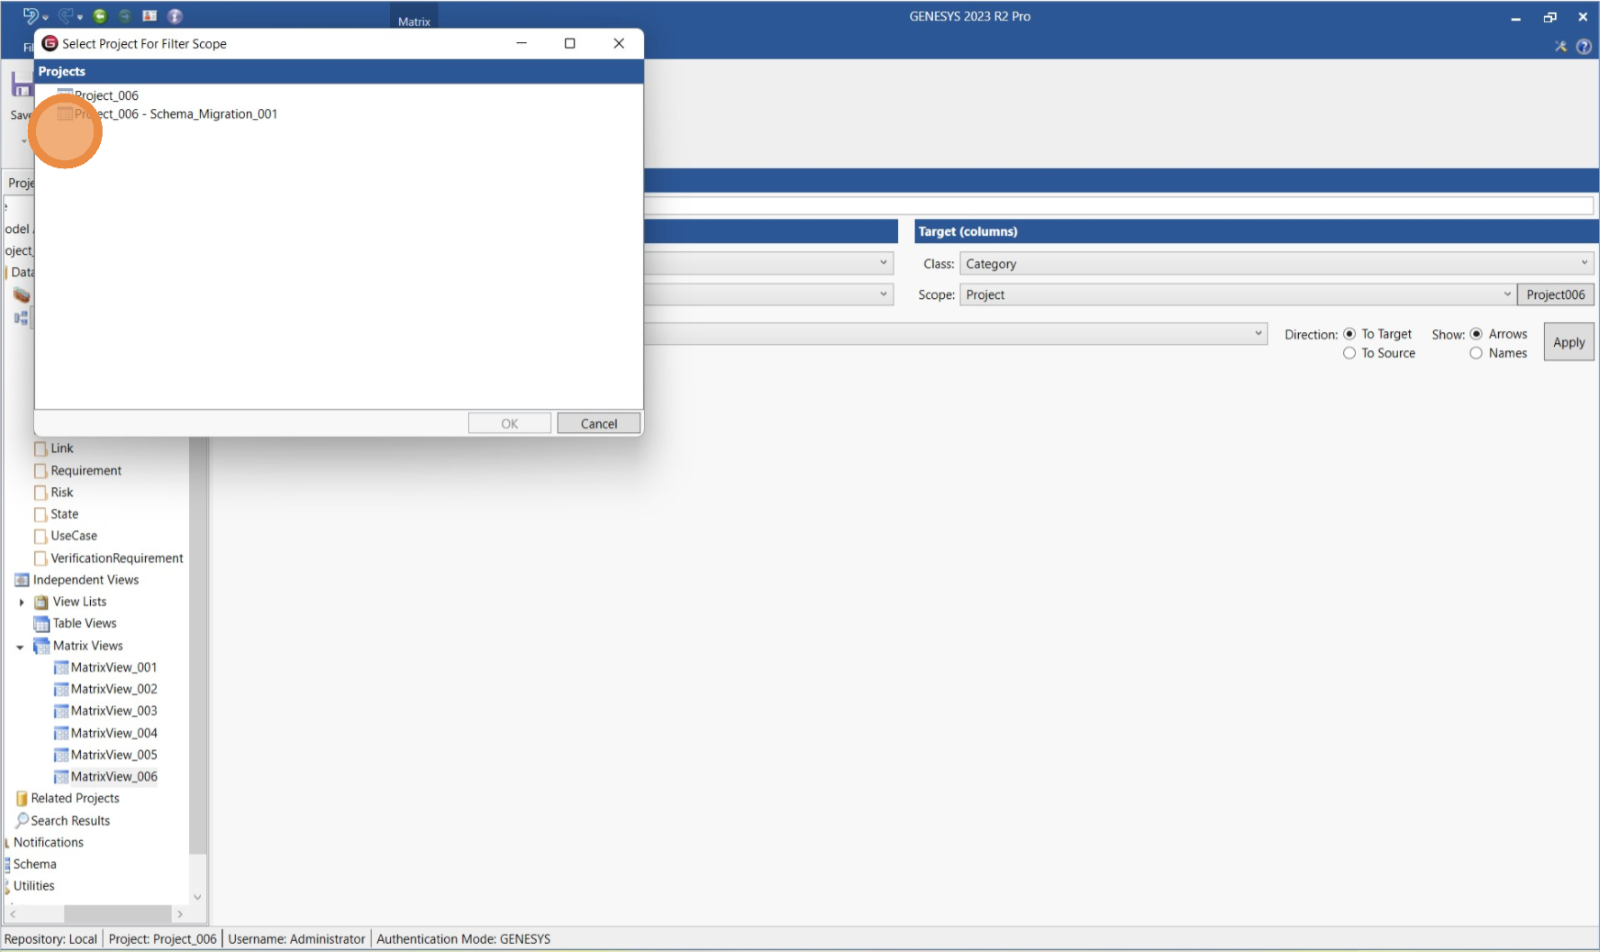
Under the “Target (column) section, click the button to the right of the “Scope” drop-down menu.
Note: The button displays the name of the selected project.
-
In the “Select Project For Filter Scope” window, select the target project to compare to the scope project.
-
Click the OK button > Apply button.